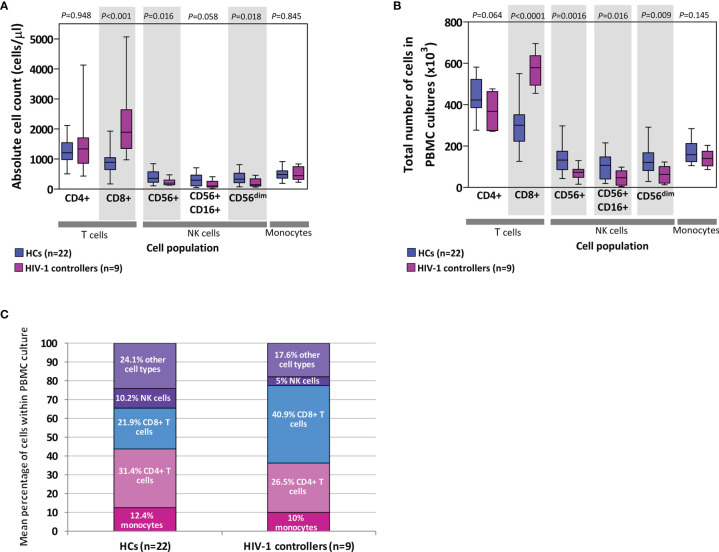
Figure 6.
Absolute counts of cells (lymphocytes and monocytes) in blood (A) as well as extrapolated number of cells used in peripheral blood mononuclear cell (PBMC) cultures (B) in healthy controls (HCs) and HIV-1 controllers (cohort 1). Shaded grey boxes indicate significant differences between the two groups with P values as indicated (Mann-Whitney U tests). Box-whisker plots depict the median (horizontal black line), 25th and 75th percentiles (margins of the box) and the 10th and 90th percentiles (whiskers). Proportional representation of different cell types within PBMCs isolated from HCs and controllers determined using the mean values from the respective groups (C). Cells referred to as “other cell types” include B cells, double-negative T cells, basophils and dendritic cells.

