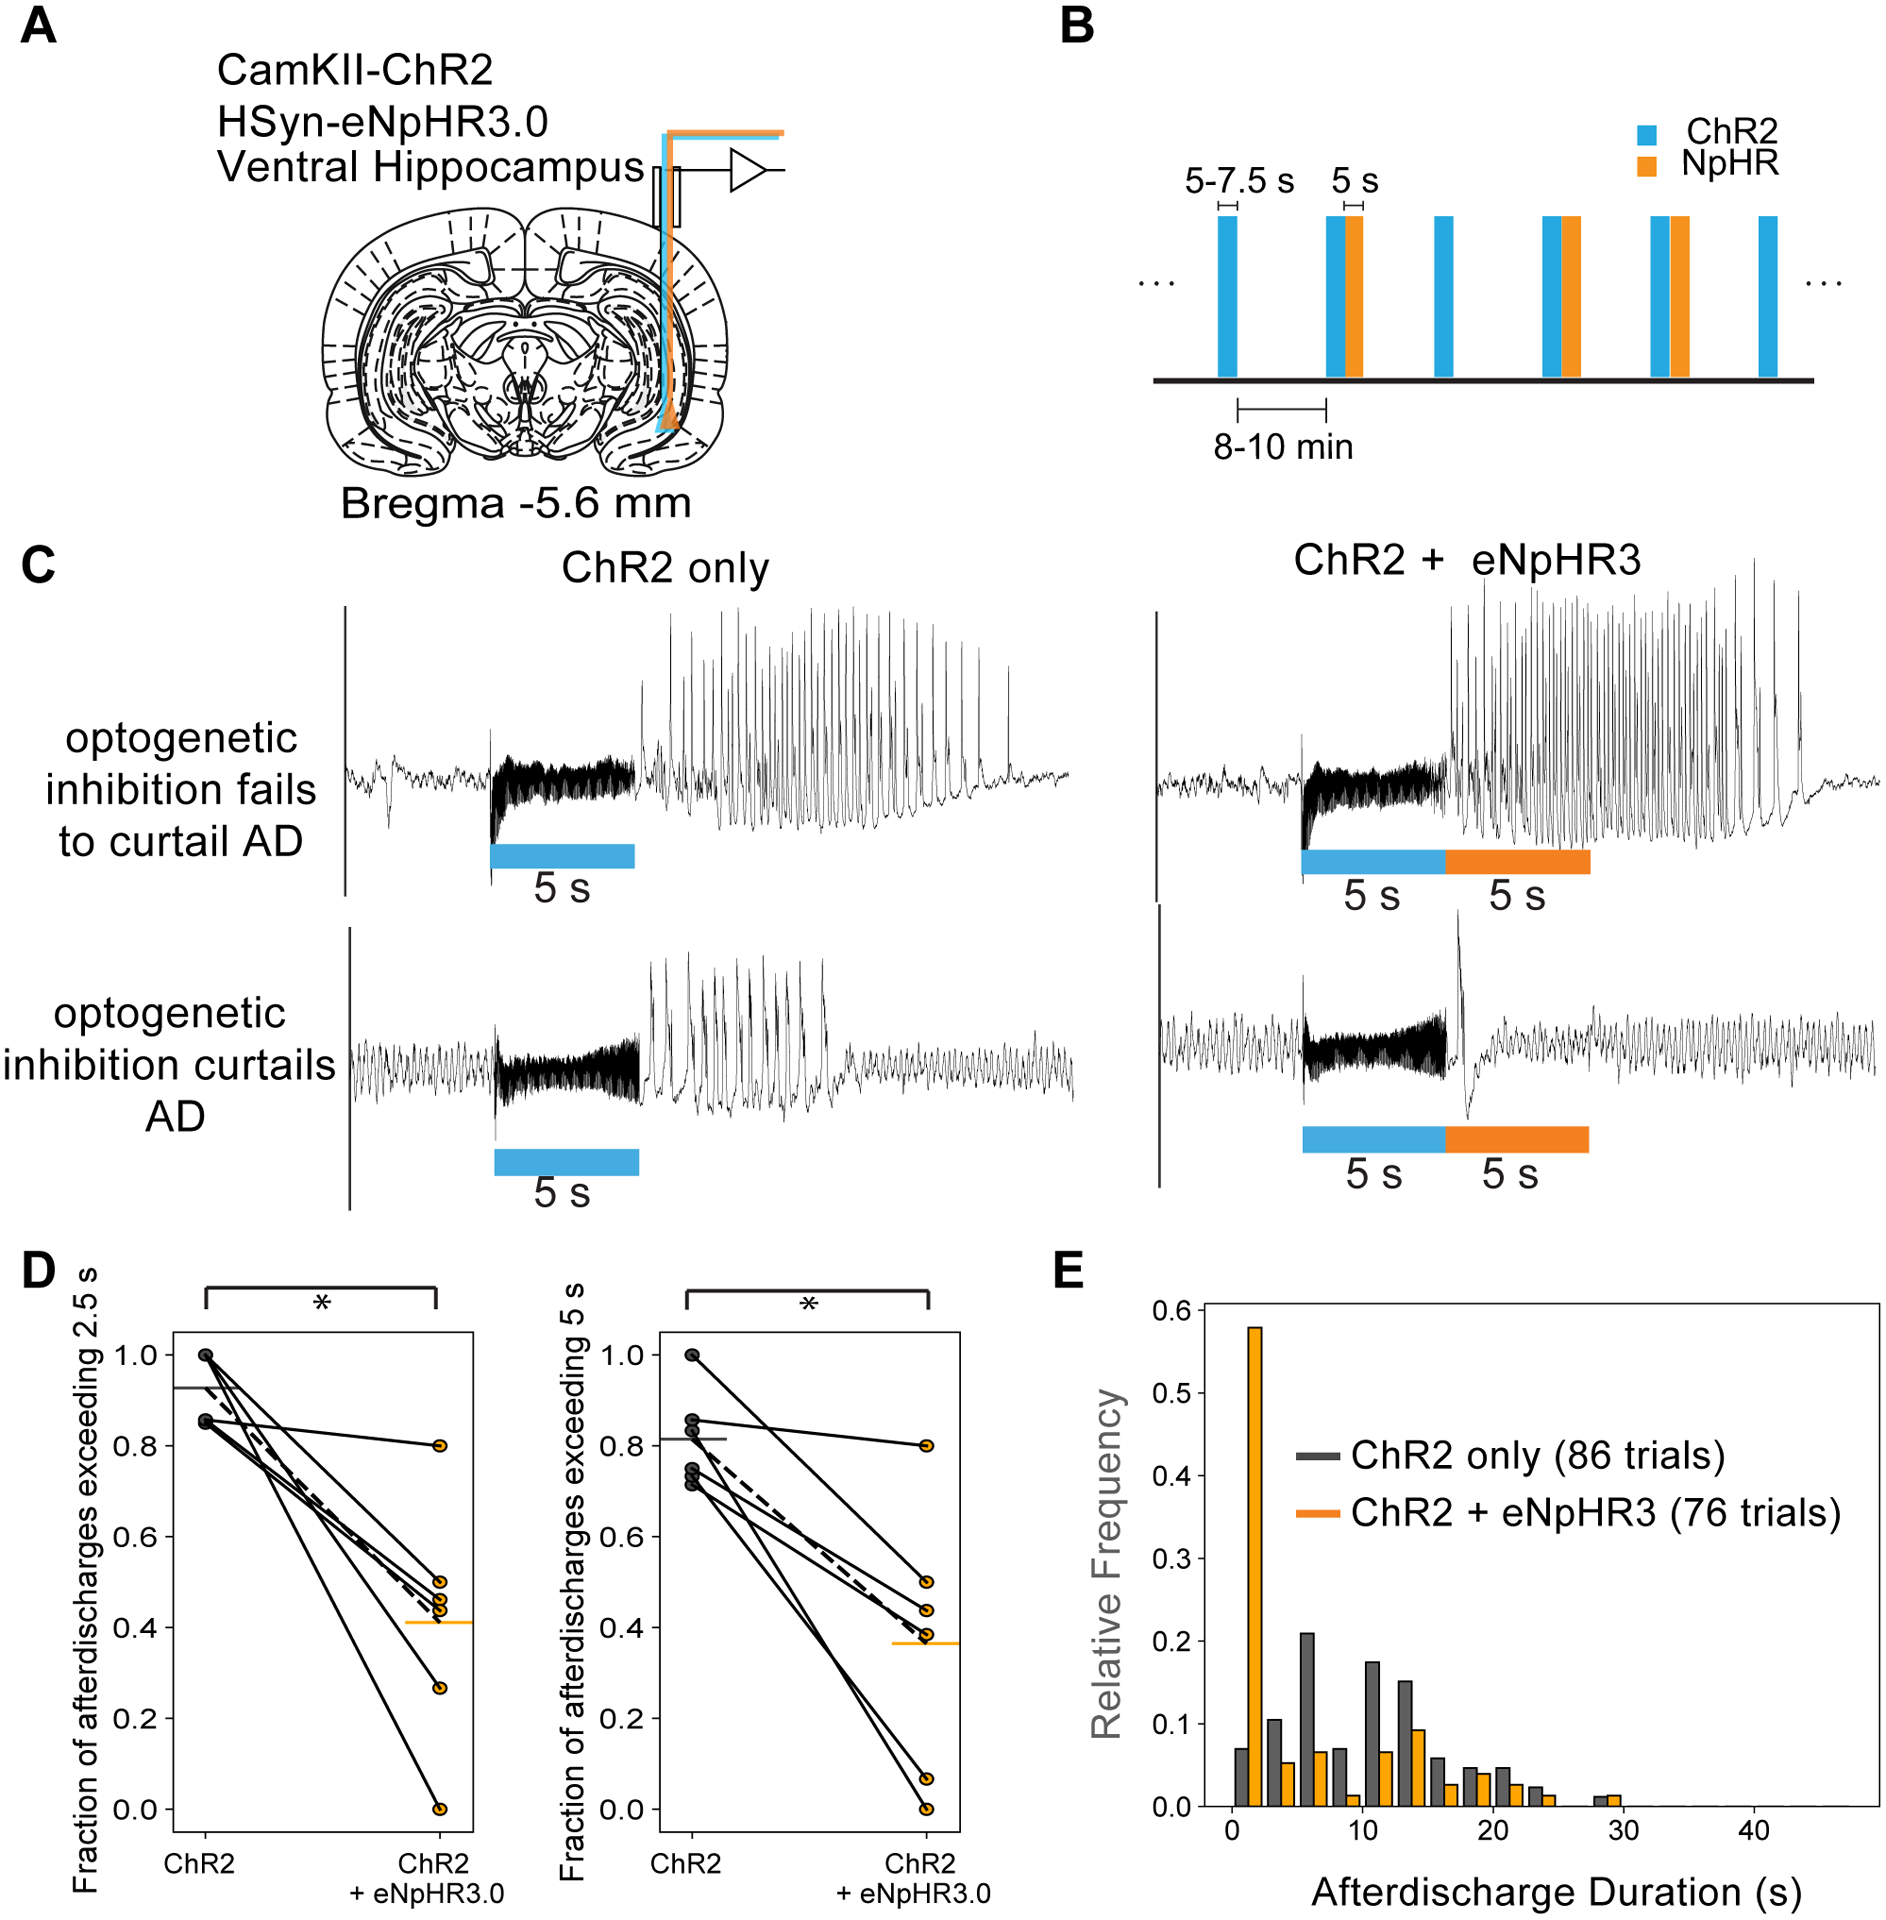
Figure 2: Local optogenetic inhibition was able to curtail seizure-like afterdischarges.

(A) Ventral hippocampus was targeted for electrophysiology and optogenetic excitation and inhibition. (B) Experimental design. ChR2 excitation only and ChR2 followed by NpHR3.0 inhibition blocks were randomized and applied with a 10 min inter-stimulus interval. Example LFP traces from rats expressing hSyn-eNpHR3.0 illustrating examples where optogenetic inhibition was considered to have failed to curtail ADs (top panels) and where optogenetic inhibition was considered to have succeeded in curtailing ADs (lower panels). The traces on the left and right panels are from the same recording sessions. The left panels are from stimulations consisting of the control condition (ChR2 only) and the right panels are from where the optogenetic inhibition was applied immediately following the ChR2 blue light stimulation. These examples illustrate that ADs from sessions where the optogenetic inhibition fails to curtail the AD appeared longer and more severe. (D) Proportion of ADs exceeding 2.5/5 s in duration for the two different conditions – the control condition (ChR2 only) vs. the optogenetic inhibition condition (ChR2 + eNpHR3). (E) Histograms of AD duration for the two different stimulation conditions. This metric was included as AD duration can be highly variable across different sessions and subjects. * p<0.05 represents based on paired t-tests for n=6 subjects.
