
Figure 3: More progressed ADs cannot be interrupted using optogenetic inhibition.
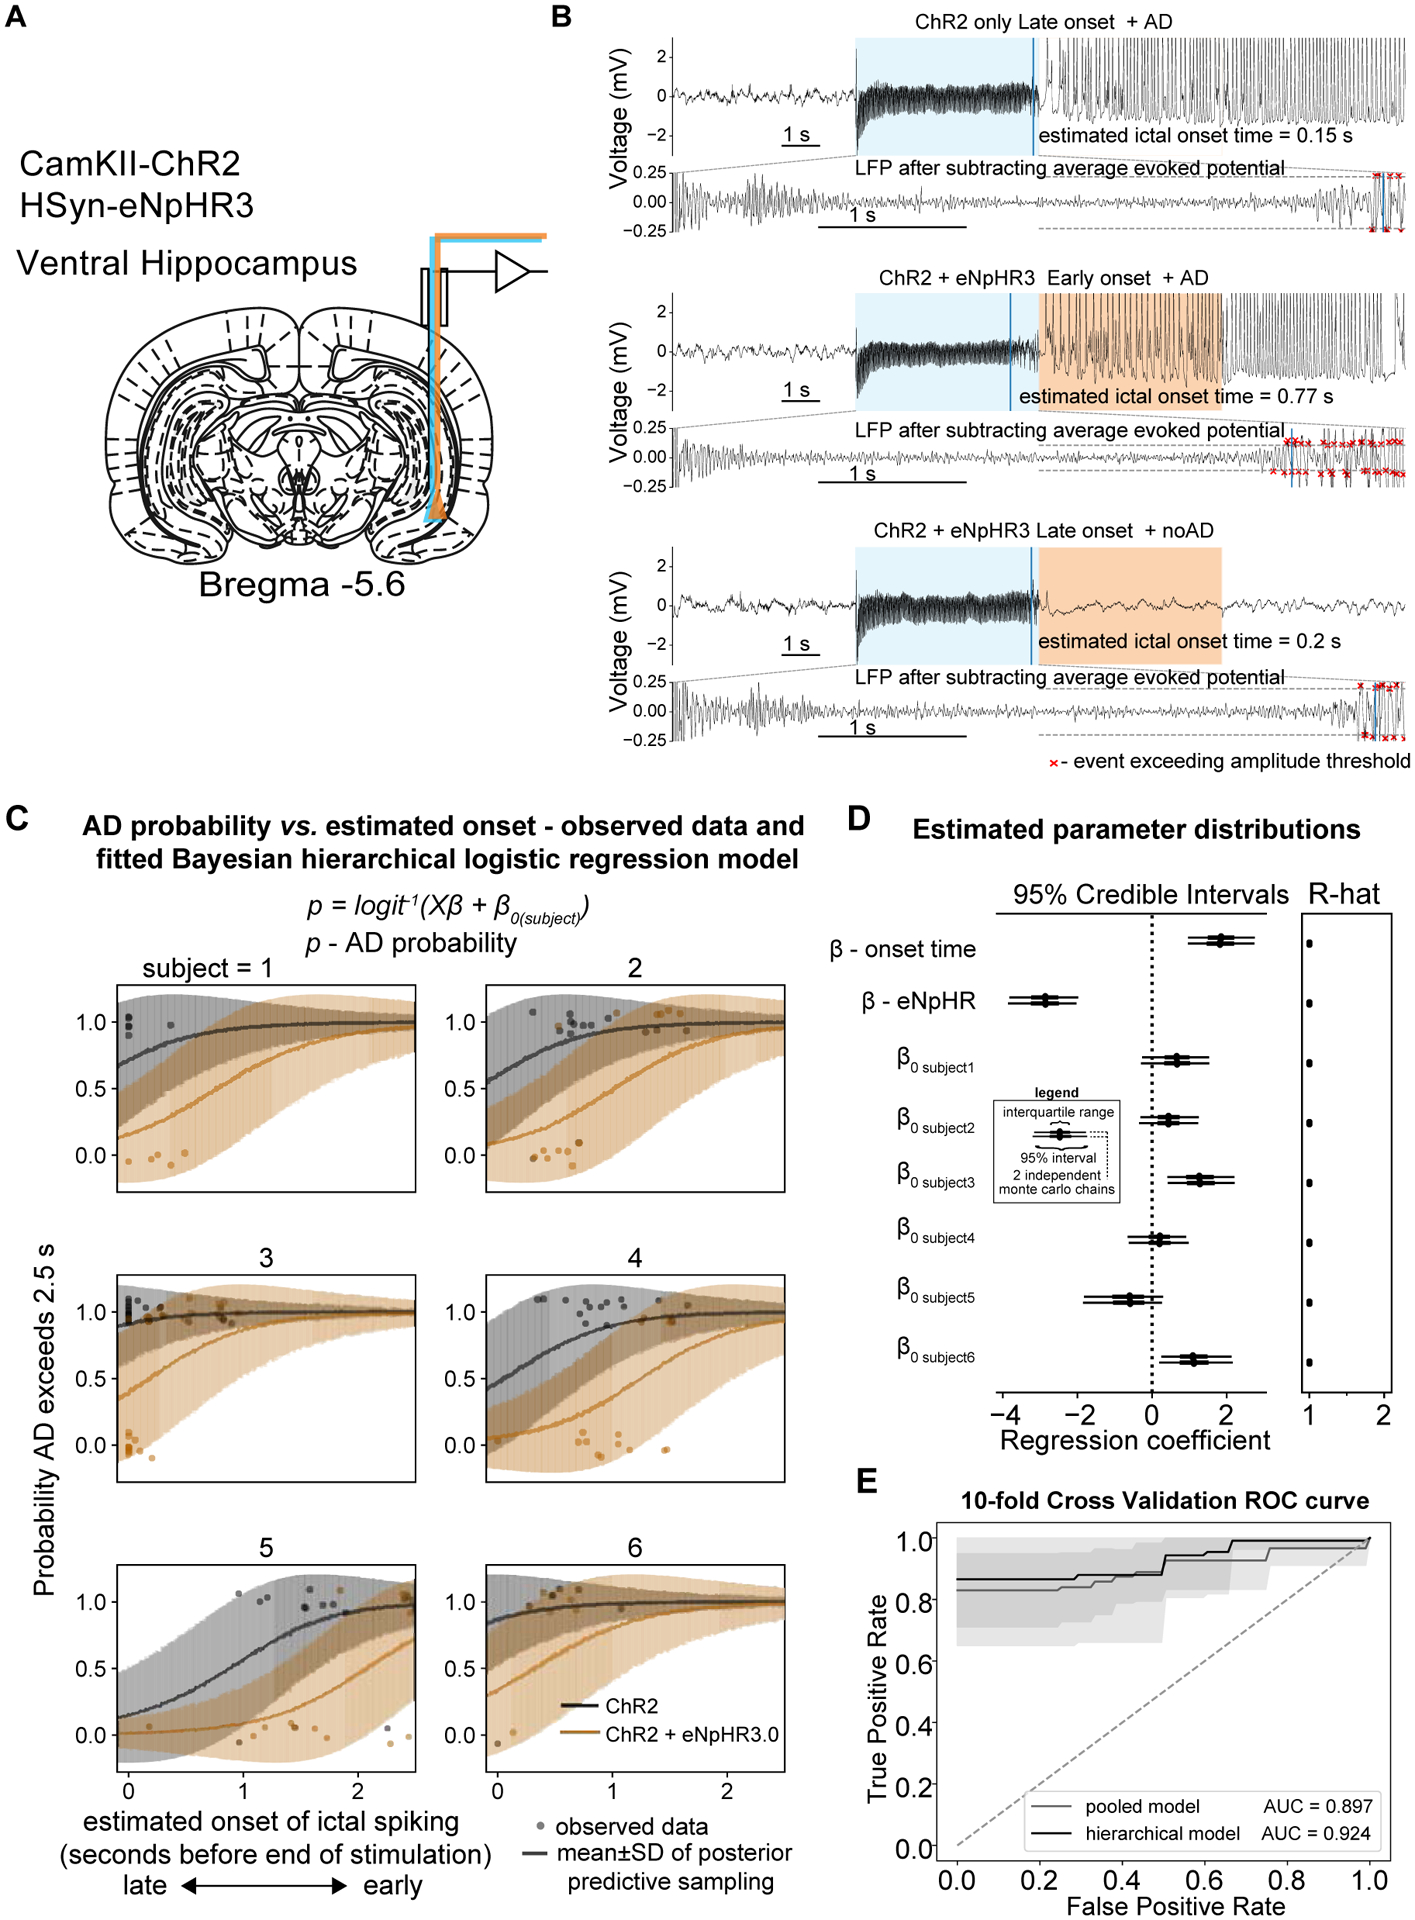
Given the relationship between ictal onset time and AD probability, the onset time was used as a covariate in a subsequent regression analysis. (A) Ventral hippocampus was targeted for electrophysiology and optogenetic excitation and inhibition. (B) Examples LFP traces indicating stimulation condition and ictal onset time from a single session. Upper panel − ChR2 only and late onset ictal activity with a sustained AD. Middle panel − ChR2 + eNpHR3.0 and early onset ictal activity with a sustained AD. Lower panel − ChR2 + eNpHR3.0 and late onset ictal activity without after discharge. (C) Modelling using a Bayesian hierarchical (random intercept) logistic regression. i.e. the log odds of the AD probability logit(p) was explained by a linear combination of the stimulation condition and ictal onset time along with a subject specific intercept term. The line shows the mean±SD of the samples from the posterior predictive distribution of the binary outcome variable e.g. AD or noAD and the individual points show the observed data. (D) Left panel - Forest plot of estimated parameter distributions showing the interquartile range and 5th and 95th percentiles for 2 independently run Monte Carlo chains. Ictal onset time and stimulation condition (ChR2 vs. ChR2 + eNpHR3.0) were both determined to be significant predictors of ADs as their 95% highest posterior density (HPD) parameter distributions did not contain zero. Right panel – Gelman-Rubin convergence statistic (r-hat) indicating convergence of Monte Carlo chains. Values here were less than 1.1 indicating good convergence. (E) 10-fold cross validation demonstrating good predictive performance of the hierarchical model compared to the pooled model. All panels include n=6 rats.