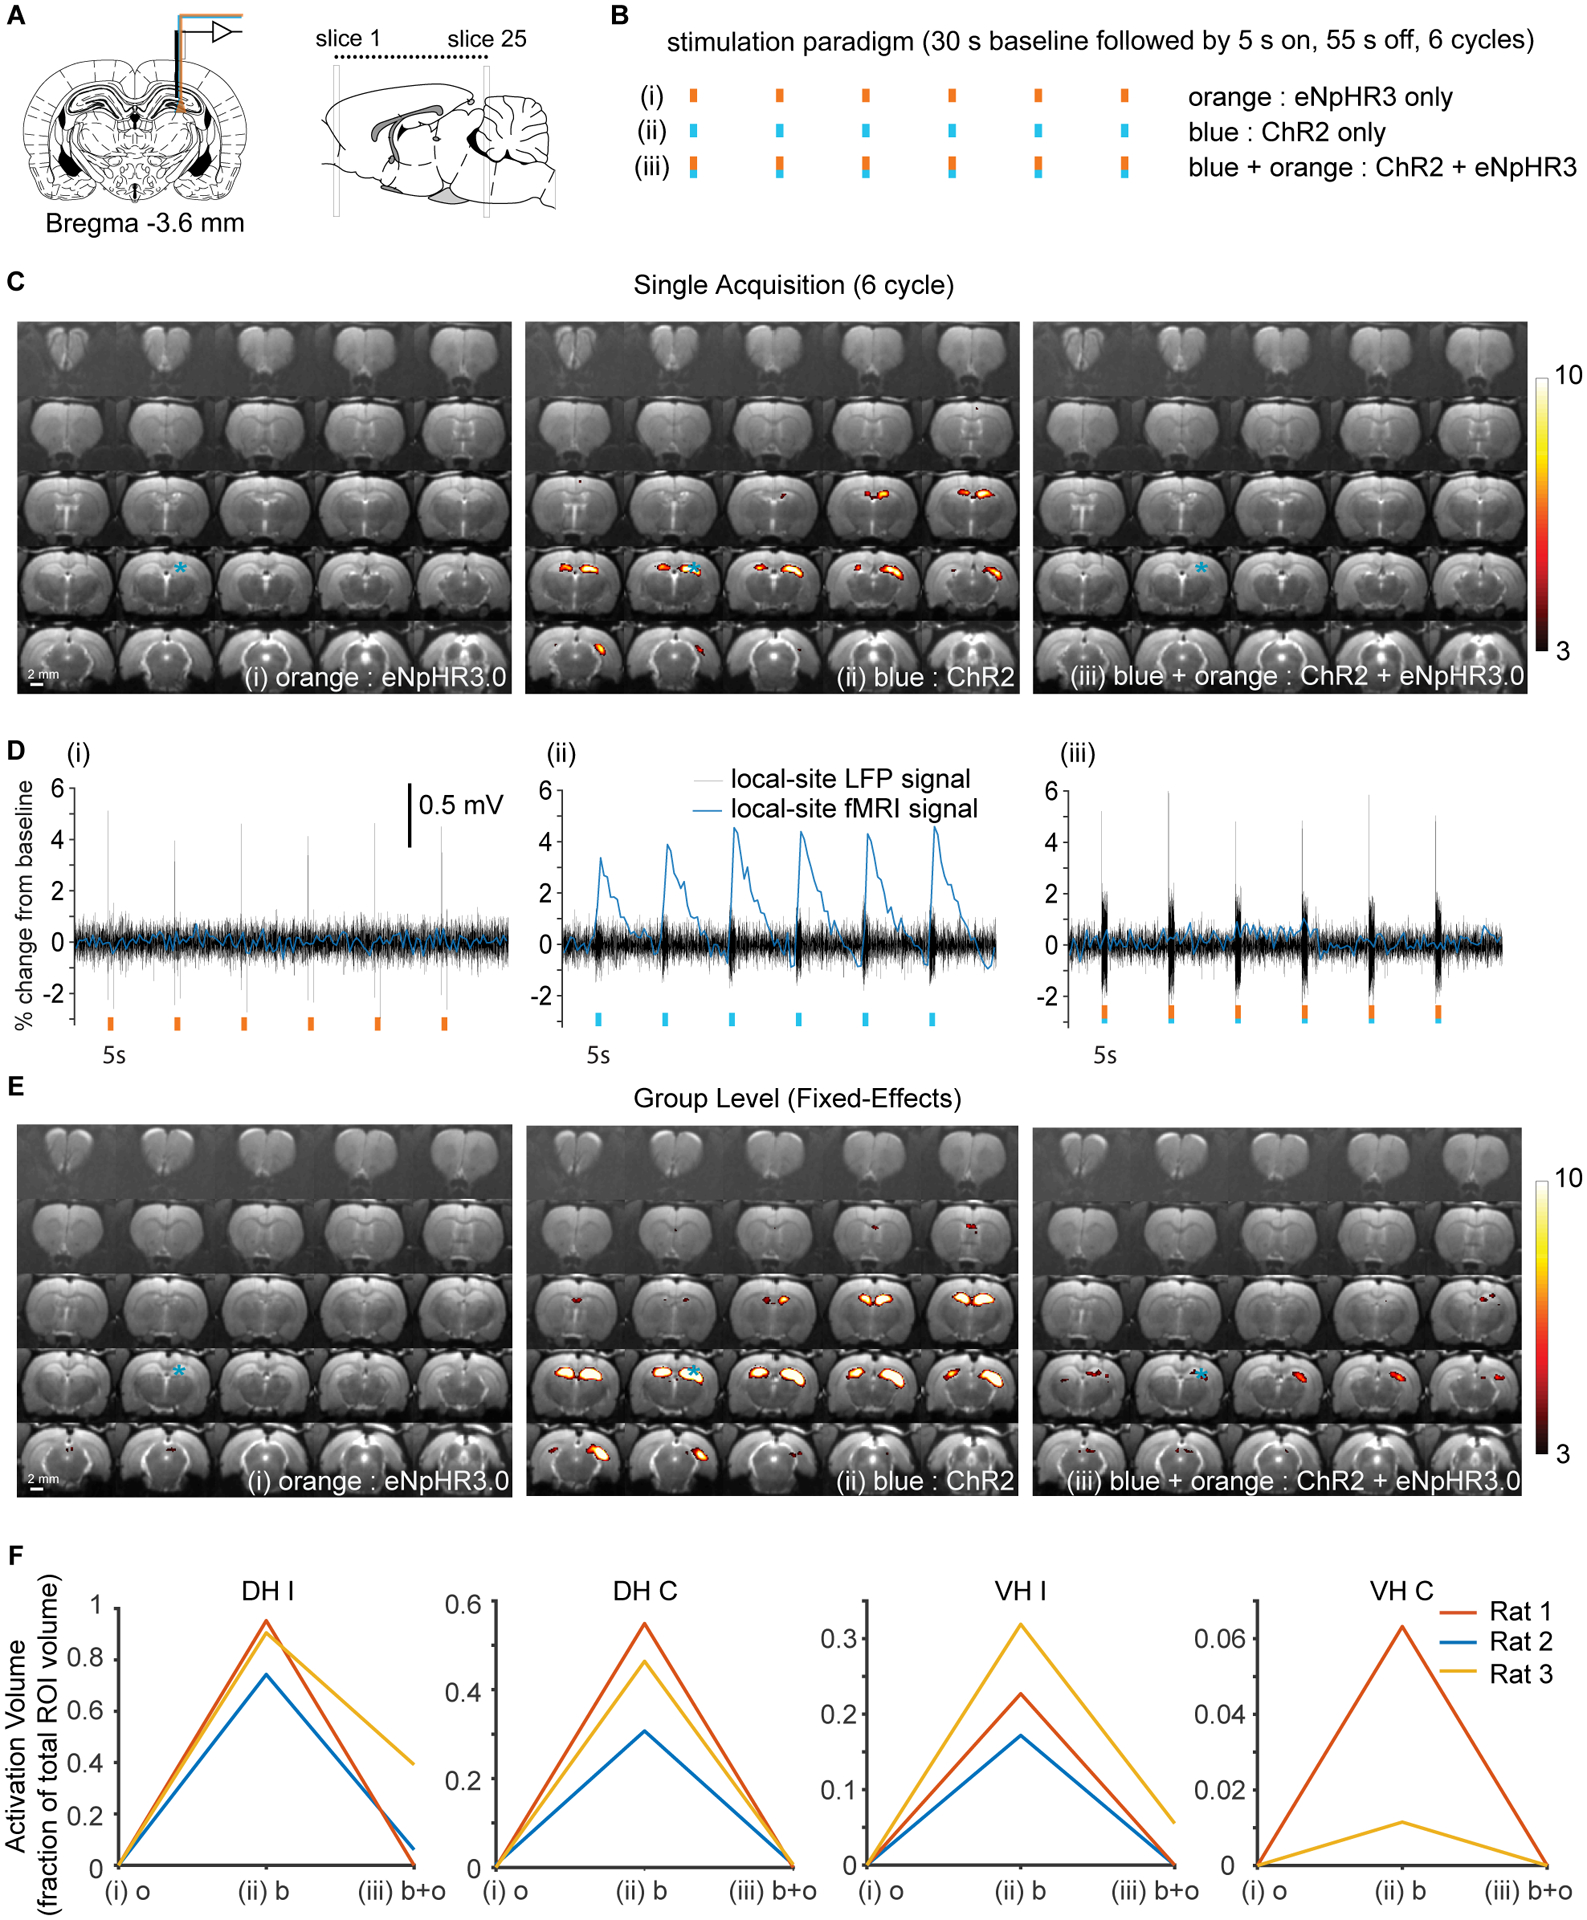
Figure 7: Optogenetic inhibition applied during optogenetic stimulation dramatically attenuates the fMRI response, while applied by itself optogenetic inhibition does not alter the CBV weighted fMRI signal.

(A) Optrodes were implanted into the dorsal hippocampus for electrophysiology and optogenetic excitation and inhibition. (B) Three separate stimulation paradigms were compared in each animal using simultaneous LFP-ofMRI. (i) Optogenetic inhibition applied on its own (eNpHR3 only). (ii) Optogenetic stimulation of ChR2 using blue light only (ChR2 only). (iii) Optogenetic stimulation and inhibition applied at the same time (ChR2 + eNpHR3 together). (C) Typical activation maps from a single trial and single subject for the three different conditions listed above. (D) Time courses for fMRI and LFP for the example data shown in (C). Note that local optogenetic inhibition applied during activation of ChR2 almost completely eliminated the fMRI response, whereas the LFP response to ChR2 stimulation remained intact. (E) Fixed-effects fMRI analysis activation maps generated from across all trials and all 3 subjects. (F) Activation volumes for the three different subjects plotted for the 4 different regions that are activated. Note that only very limited activation occurred in one rat when halorhodopsin and ChR2 were activated simultaneously using blue and orange light. Abbreviations: DH I – dorsal hippocampus ipsilateral, DH C - dorsal hippocampus contralateral, VH I – ventral hippocampus ipsilateral, VH C – ventral hippocampus contralateral. All activation maps are shown at p< 0.001, uncorrected. E to change to orange, blue then blue + orange
