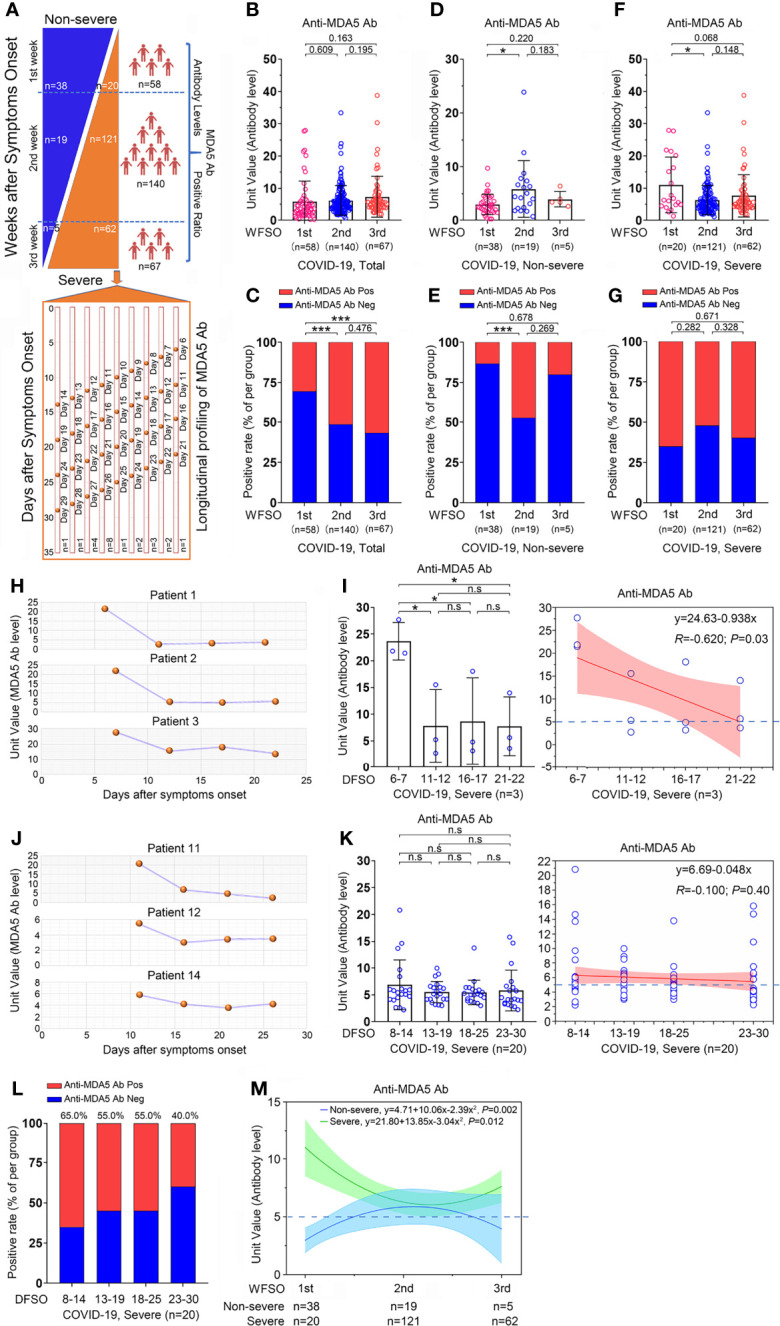
Figure 4.

Overview of the anti-MDA5 profile in COVID-19. (A), Overview of the cross-sectional and longitudinal analyses in COVID-19. (B, C), A cross-sectional analysis of the anti-MDA5 Ab titer (B) and positive rate (C) is employed in 273 cases of COVID-19 patients. (D, E), A cross-sectional analysis of the anti-MDA5 Ab titer (D) and positive rate (E) is performed in non-severe COVID-19 patients. (F, G), A cross-sectional analysis of the anti-MDA5 Ab titer (F) and positive rate (G) is performed in severe COVID-19 patients. The samples were stratified into three clusters: WFSO-1, WFSO-2, and WFSO-3. The numbers of COVID-19 patients in each cluster are indicated underneath. P values were determined by using unpaired, two-sided Mann-Whitney U-test and χ2 test. P < 0.05, *; P < 0.001, ***. (H, I), A longitudinal analysis of anti-MDA5 Ab profiling in 3 patients (H). 4 time-points were selected, which began from WFSO-1 (Patient 1, DFSO-6; Patient 2, 3, DFSO-7) [(I), left panel]. Longitudinal data were also plotted over time continuously according to DFSO. Regression lines are indicated using the red solid line [(I), right panel]. (J, K), A longitudinal analysis of anti-MDA5 Ab profiling in 20 patients. Of them, patient 11, 12, and 14 were shown in panel (J) 4 time-points were selected, which began from DWSO-2 [(K), left panel]. Longitudinal data were also plotted over time continuously according to DFSO. Regression lines are indicated using the red solid line (K, right panel). (L), The positive rate of anti-MDA5 Ab determined in 20 patients as stated above at DFSO 8-14, 13-19, 18-25, and 23-30. (M), The cross-sectional data was also plotted according to days following symptom onset. Regression lines are indicated by the blue (non-severe) or green (severe) solid lines. The numbers of COVID-19 patients in each cluster are indicated underneath. P values were determined by using unpaired, two-sided Mann-Whitney U-test and χ2 test. P < 0.05, *; P < 0.001, ***; ns, no significance.
