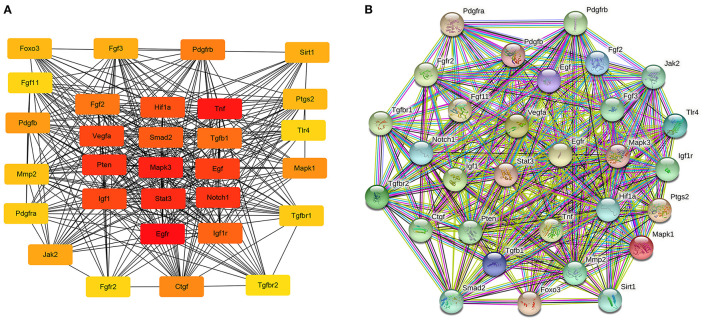
Figure 6.
The potential interactions of hub genes in the PPI network in aortic vascular tissues of rats. (A) The top 30 hub genes were selected by the cytoHubba app in Cytoscape 3.8.2 software; The node color changes gradually from yellow to red in ascending order according to the score of hub genes. (B) The protein and protein interaction of top 30 hub genes by the online database STRING (involving 30 nodes and 344 edges). PPI, protein and protein interaction.

