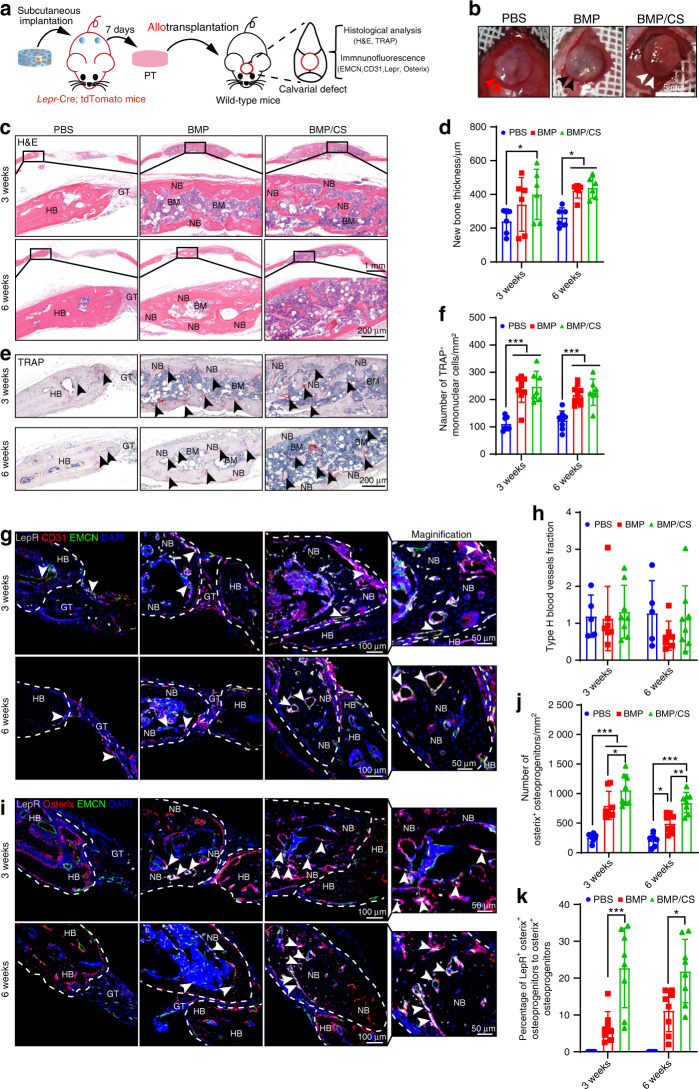
Fig. 3.
Functional PTDCs lodged in PTs participate in osteogenesis and osseointegration during allogenic transplantation. a Scheme of the experiments for allogenic transplantation with the PTs from the PBS, BMP, and BMP/CS groups. Freeze-dried PBS-, BMP-, or BMP/CS-loaded scaffolds were subcutaneously implanted in Lepr-cre; tdTomato mice for 1 week (n = 6). Then, the obtained PTs were engraved for transplantation. b Surgery for allogenic transplantation for critical-sized calvarial defect repair in wild-type mice. Images were taken at the initial surgical procedure. The red arrowhead indicates animals transplanted with allogenic PT from the PBS group, the black arrowhead indicates animals transplanted with allogenic PT from the BMP group, and the white arrowhead indicates animals transplanted with allogenic PT from the BMP/CS group. c–f Representative images and quantitative analysis of H&E (c, d) and TRAP (e, f) staining of cranial samples from the PBS, BMP, and BMP/CS groups at weeks 3 and 6 after allogenic transplantation in wild-type mice. g–k Representative images and quantitative analysis of immunofluorescence staining of type H vessels (EMCN + CD31 +, yellow; g, h), Osterix+ osteoprogenitors (red; i, j) and Lepr-cre; tdTomato donor-derived osteoprogenitors (i, k) in the PBS, BMP, and BMP/CS groups at weeks 3 and 6 after allogenic transplantation in young mice. Granulation tissue GT, bone marrow BM, new bone NB, host bone HB. The black arrowhead indicates TRAP-positive cells (e). Lepr-cre; tdTomato-positive cells are white, EMCN-positive cells are green, CD31- and Osterix-positive cells are red, and DAPI is blue (nucleus). The white dashed line indicates the host bone or new bone area (g, i). The white arrowhead indicates type H blood vessels (g) and LepR+Osterix+ osteoprogenitors (i). Scale bar (top: low magnification, 1 mm; bottom: high magnification, 200 μm; c, e) and (left: low magnification, 100 μm; right: high magnification, 50 μm; g, i). Biological replicates are 5–8. Data are presented as the mean ± SD. *P < 0.05, **P < 0.01, ***P < 0.001, two-way ANOVA followed by Bonferroni’s post hoc tests

