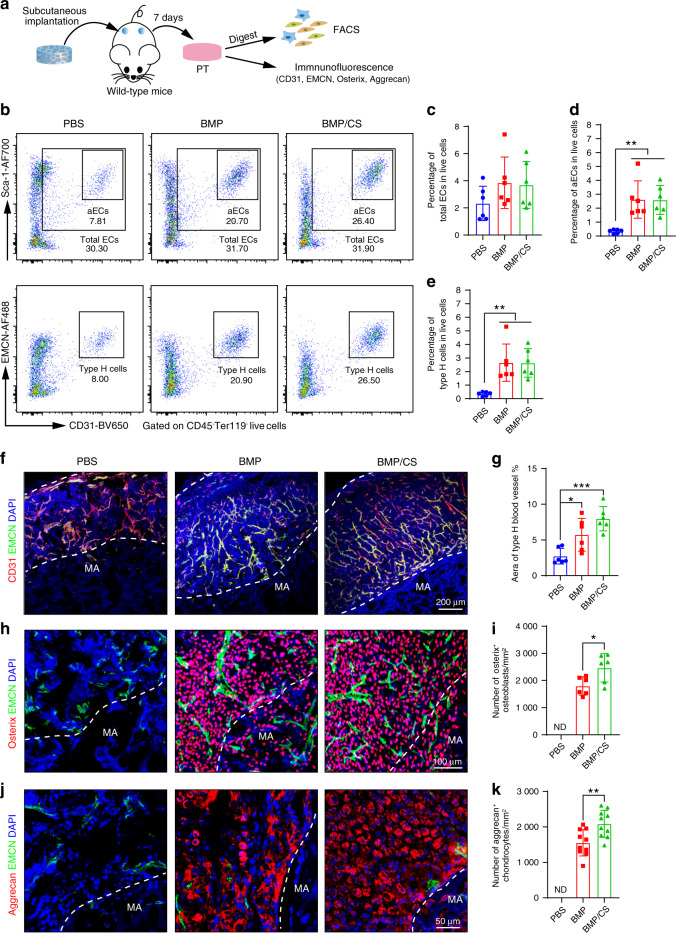
Fig. 4.
Evaluation of functional blood vessels and osteochondral progenitor cells in PTs. a Scheme of the experiments for evaluating the abundance of blood vessels and osteochondral progenitor cells in PTs from the PBS, BMP, and BMP/CS groups. b Representative flow cytometric profiles of total endothelial cells (total ECs), arteriolar ECs (aECs) and type H cells of the PBS, BMP, and BMP/CS groups 1 week after subcutaneous implantation in wild-type mice (n = 6). c–e Quantitative flow cytometric analysis of total ECs (Ter119−CD45−CD31 + Sca-1+, c), aECs (Ter119-CD45-CD31hiSca-1hi, d) and type H blood cells (Ter119-CD45-CD31 + EMCN +, e) in the BMP and BMP/CS groups 1 week after subcutaneous implantation in young wild-type mice. Data are from individual animals and are shown as the mean ± SD. **P < 0.01, one-way ANOVA followed by Tukey’s post hoc tests. f–k Immunofluorescence staining and quantitative analysis of type H blood vessels (EMCN + CD31 +, yellow; f, g), Osterix+ osteoprogenitors (red; h, i), and Aggrecan+ chondrocytes (red, j, k) in the PBS, BMP, and BMP/CS groups 1 week after subcutaneous implantation in wild-type mice (n = 6–8). CD31-positive cells, Osterix-positive cells, and Aggrecan-positive cells are red, EMCN-positive cells are green, and DAPI is blue (nucleus). Materials (MA). The white dashed line indicates the border of the material area and PT area. Data are from individual animals and are shown as the mean ± SD. *P < 0.05, **P < 0.01, ***P < 0.001, one-way ANOVA followed by Tukey’s post hoc tests. Scale bar, 200 μm (f), 100 μm (h), and 50 μm (j)

