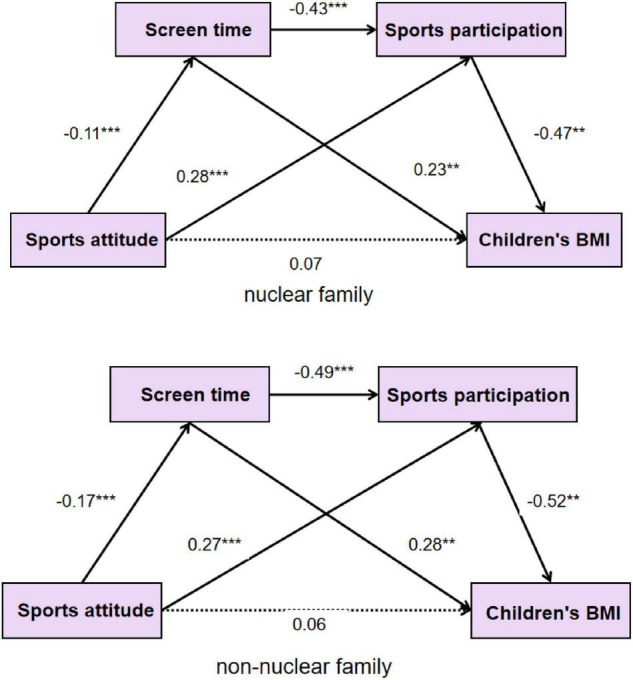
FIGURE 2.

Path relationship between family sports attitude, sports participation, screen static time, and children’s BMI in different family structures.

Path relationship between family sports attitude, sports participation, screen static time, and children’s BMI in different family structures.