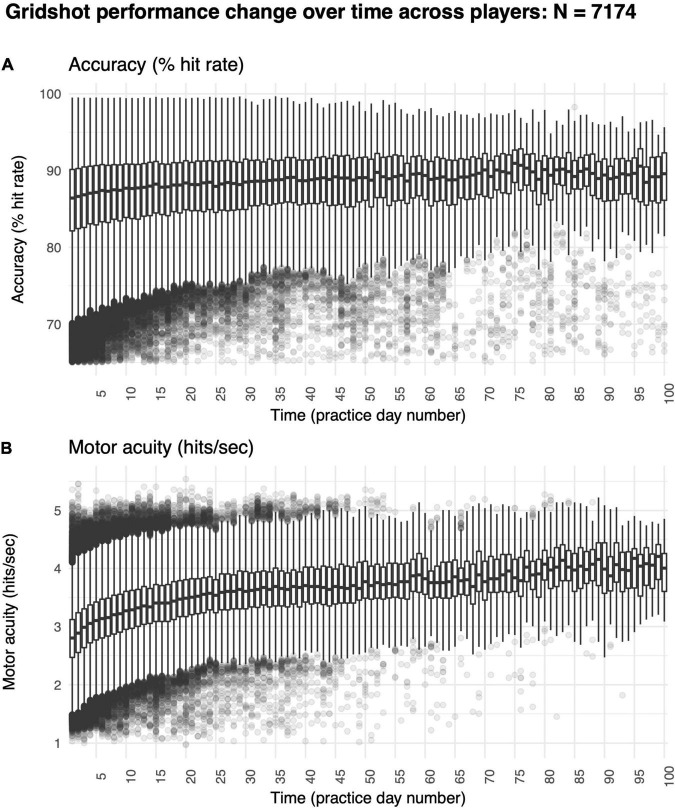
FIGURE 5.
Improvements in motor skill over 60 days of shooting practice. (A) Changes in motor performance accuracy (hit rate: percentage of shots attempted that hit targets) and (B) motor acuity (hits per second: number of accurate shots that hit targets every second). Box plots denote the median (thick horizontal lines), quartiles (1st and 3rd, the edges of the boxes), extrema (min and max, vertical thin lines), and outliers (Q1 +/− 1.5*IQR, points).

