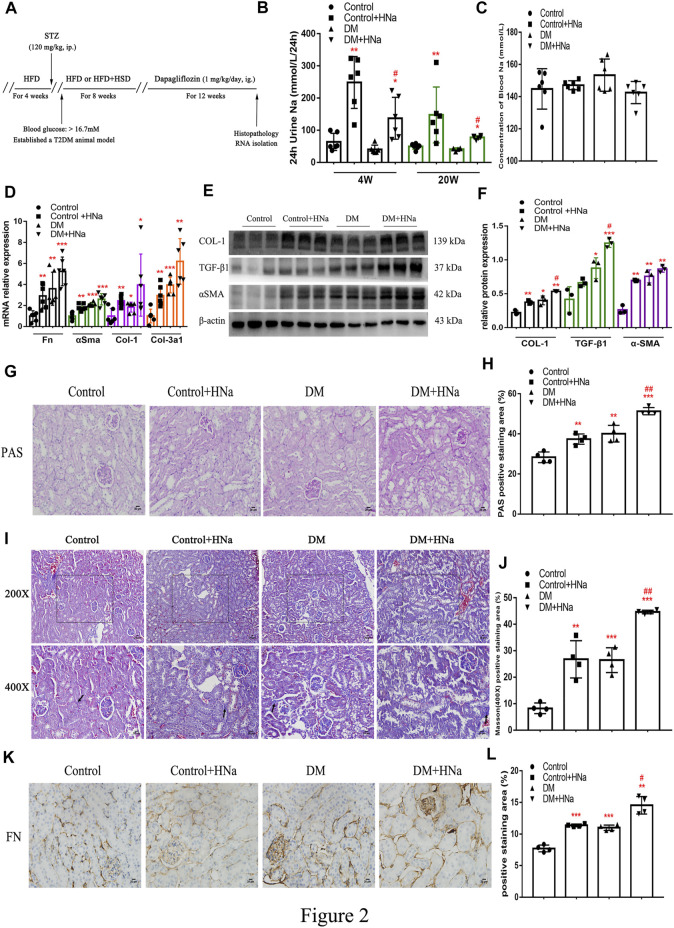
FIGURE 2.
| High-salt diet aggravates renal fibrosis in diabetic mice. (A) Schematic diagram of the experiment plan. After HFD for 4 weeks, intraperitoneal injection of STZ was performed. One week later, blood glucose was detected and diabetic mice were selected to be fed with high-salt diet for 8 weeks, followed by dapagliflozin by gavage for 12 weeks. (B) 24 h urine Na was measured at 4 weeks and 20 weeks after high-salt diet (n = 6 per group). (C) Blood Na was measured at 20 weeks after high-salt diet (n = 6 per group). (D) The levels of Fn, αSma, Col-1 and Col-3a1 were detected by RT-qPCR (n = 6 per group). (E,F) Western Blot were performed to determine the COL-1, TGF-β1 and αSMA expression levels (n = 3 per group). (G,H) PAS staining of paraffin-embedded renal sections (magnification, 400×, bar = 20 μm, n = 4 per group). (I,J) Masson’s trichrome staining of paraffin-embedded renal sections (magnification, 400×, bar = 20 μm, n = 4 per group). (K,L) FN antibody staining of paraffin-embedded kidney sections (magnification, 400×, bar = 20 μm, n = 4 per group). All data are mean ± SEM, *p < 0.05, **p < 0.01 and ***p < 0.001 vs. Control group; #p < 0.05 and ##p < 0.01 vs. DM group.

