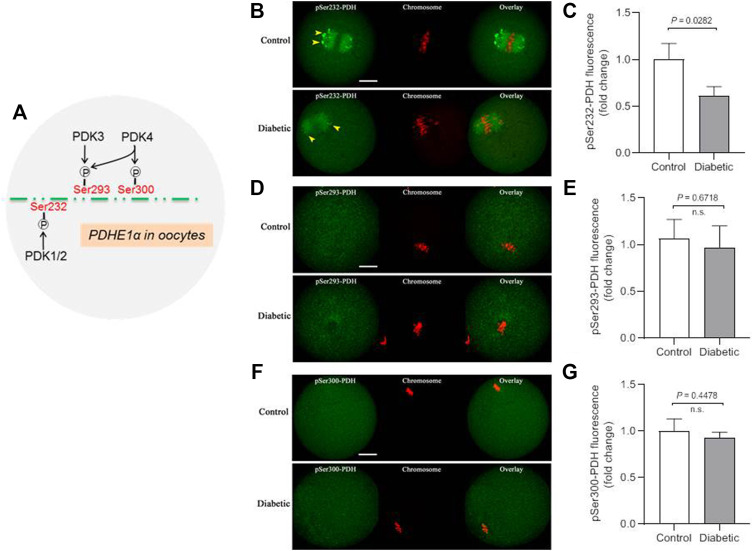
FIGURE 2.
Lowered phosphorylation level of Ser232-PDHE1α in oocytes from diabetic mouse. (A) Schematic representation of the PDK paralog phosphorylation site specificity for oocyte PDHE1α. (B) Representative images of control and diabetic oocytes stained with antibodies against pSer232-PDHE1α (green) and co-stained with Propidium Iodide (PI, red) for chromosome. (C) Quantification of pSer232-PDHE1α fluorescence show in (B). (D) Representative images of control and diabetic oocytes stained with antibodies against pSer293-PDHE1α (green) and co-stained with PI (red) for chromosome. (E) Quantification of pSer293-PDHE1α fluorescence show in (D). (F) Representative images of control and diabetic mouse oocytes stained with antibodies against pSer300-PDHE1α (green) and co-stained with PI (red) for chromosome. (G) Quantification of pSer300-PDHE1α fluorescence show in (F). Yellow arrowheads point to the pSer232-PDH signal in control and diabetic oocytes. Scale bar: 20 µm. At least 30 oocytes for each group were analyzed, and the experiments were repeated three times. Error bars indicate ± SD, a Student’s t test was used for statistical analysis. n.s., not significant.

