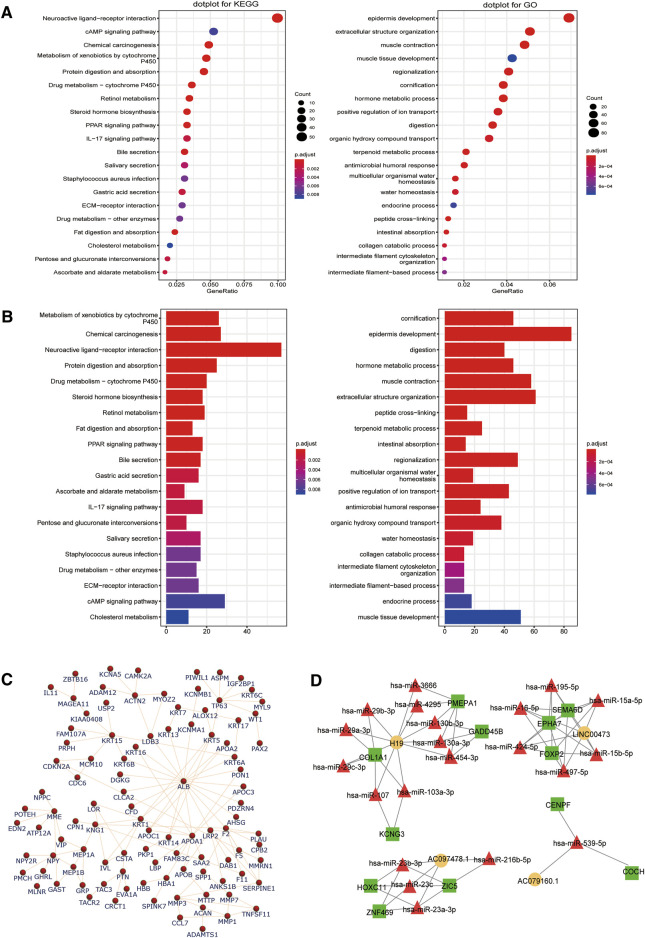
FIGURE 4.
Identification of key pathways and proteins related to the differentially expressed long noncoding RNAs (lncRNAs) and messenger RNAs (mRNAs) involved in the competitive endogenous RNA (ceRNA) network. Top 20 enriched Kyoto Encyclopedia of Genes and Genomes (KEGG) pathway and gene ontology (GO) enrichment analysis of the differentially expressed (A) lncRNAs and (B) mRNAs. The count represents the genes related to the GO term in KEGG or biological processes. (C) In the network diagram, the genes are depicted by the nodes while the interactions are shown by the edges. These protein–protein interactions are based on mRNAs, and the network was constructed using the STRING tool. (D) The lncRNA–microRNA–mRNA network was designed using the correlation analysis between all the DERNAs. Legend: square, mRNA; circle, lncRNA; triangle, miRNA. Orange, red, and green symbols represent upregulated lncRNAs, downregulated miRNAs, and upregulated mRNAs, respectively.

