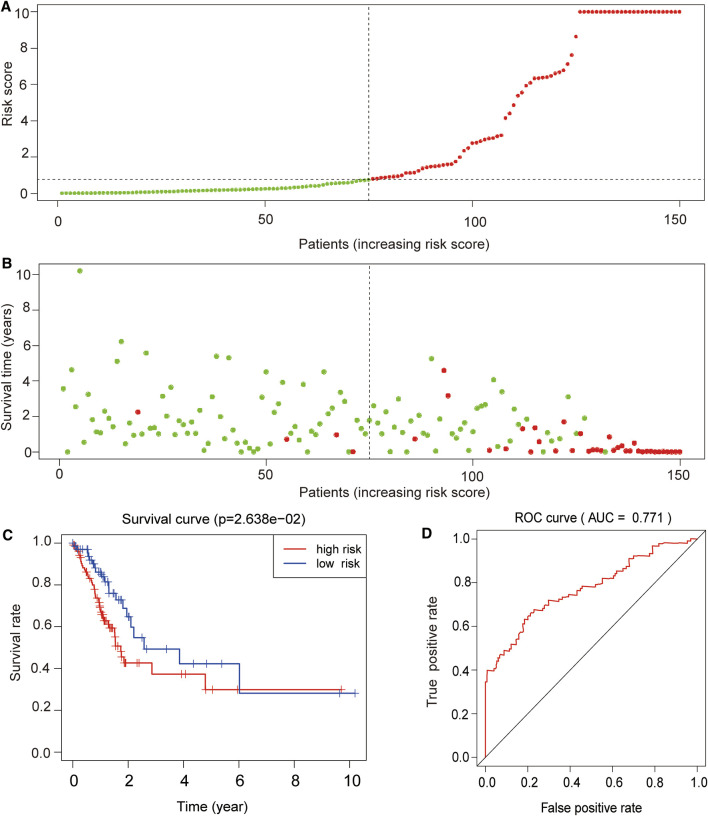
FIGURE 7.
External validation of the prognostic value of the four lncRNA signatures. (A) Risk curve and (B) survival status chart of the validation dataset based on the proposed prognostic model. Each dot represents an individual patient, and the y-axis indicates the respective risk score. Green and red colors indicate the low- and high-risk groups, respectively. (C) Kaplan–Meier survival and (D) receiver operating characteristic (ROC) curves of the validation dataset based on the proposed prognostic model. The x-axis represents the overall survival time in years, and the y-axis indicates the survival rate of the patients according to their defined risk group. p-values were calculated by the log-rank test. Analysis of the area under the ROC curve (AUC = 0.771) indicated that the proposed model had a good risk prediction potential.

