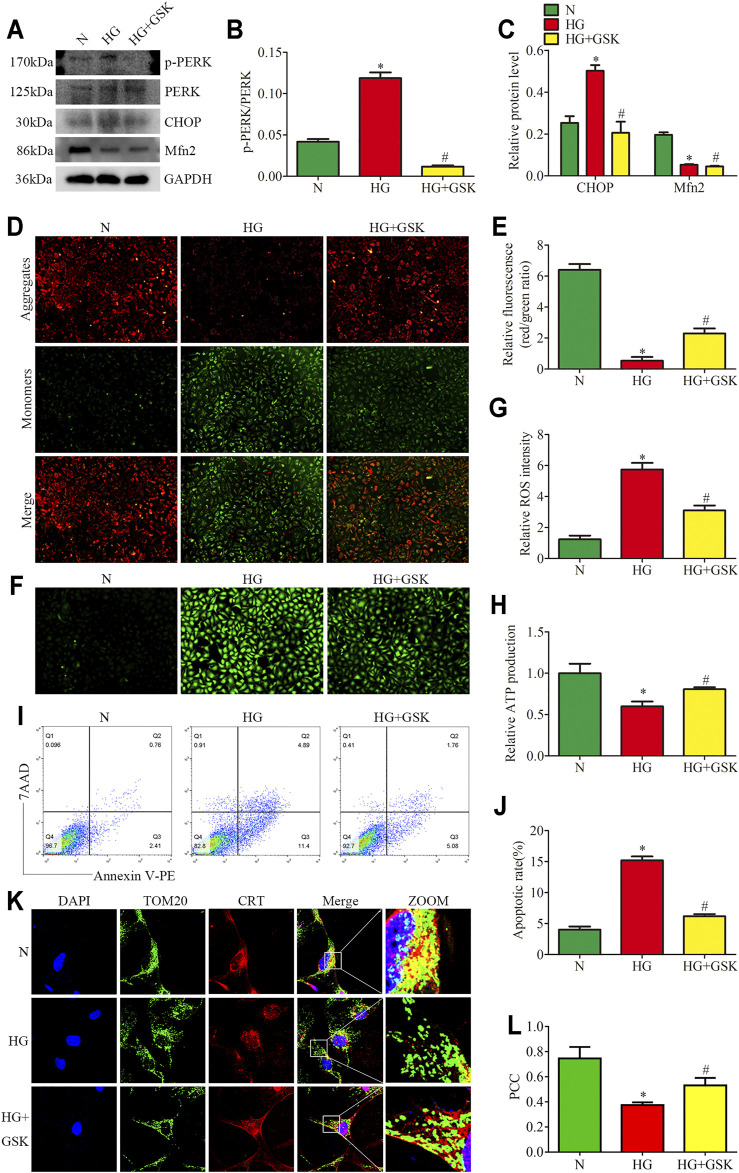
FIGURE 6.
Effects of PERK inhibition on HG-induced mitochondrial dysfunction and MAMs reduction. (A–C) Representative Western blots of p-PERK, PERK, CHOP, Mfn2 expression and quantitation per group (n = 3). (D,E) Representative images of MMP in cultured podocytes by JC-1 staining and quantification per group (n = 3) (original magnification, ×100). (F,G) Representative images of DCFH-DA fluorescence (green) in cultured podocytes to assess ROS production and quantification per group (n = 3) (original magnification, ×100). (H) ATP production was assessed and quantification per group (n = 3). (I,J) Flow cytometry analysis of apoptosis in cultured podocytes and quantitation per group (n = 3). (K) Representative images of immunofluorescent staining of TOM20, CRT and DAPI in cultured podocytes per group (original magnification, ×1,000) (L) Quantitation of PCC of TOM20 and CRT in Figure 6K per group (n = 3). N = 5 mM glucose for 24 h; HG = 25 mM glucose for 24 h; HG + GSK = 25 mM glucose and 20 μM GSK2656157 for 24 h; NS, not significant; *p < 0.05 compared with podocytes cultured in normal conditions; #p < 0.05 compared with podocytes treated with HG.

