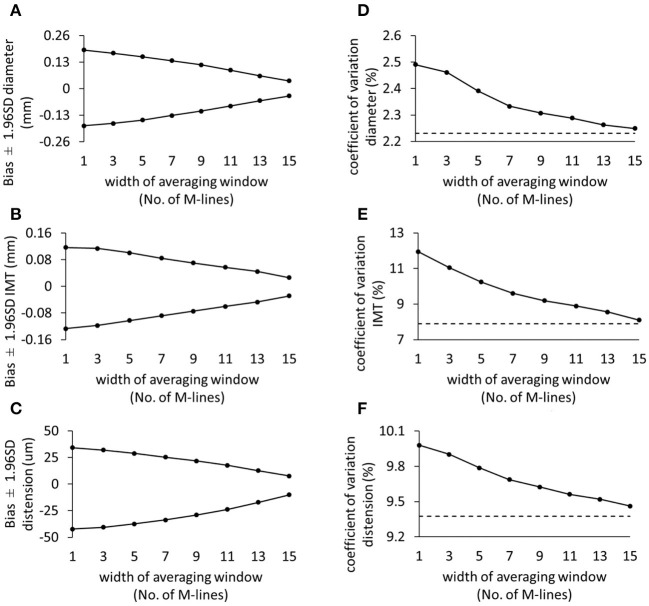
Figure 4.
The effect of increasing the spatial averaging window on the validity (A–C) and reproducibility coefficient of variation (D–F) for diameter, intima-media thickness, and distension, respectively. The dashed lines represent the reproducibility of the multiple M-line method (i.e., including all 17 M-lines). SD, standard deviation; IMT, intima-media thickness.

