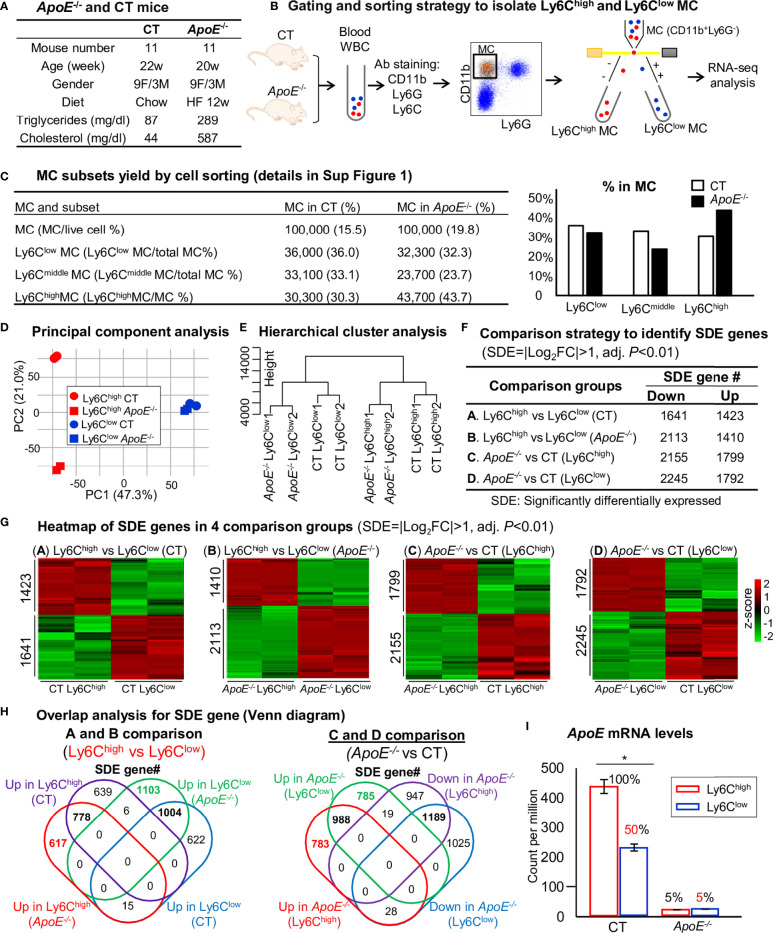
Figure 2.
RNA-Seq analysis and SDE gene identification from blood Ly6Chigh and Ly6Clow MC of control and ApoE -/- mice. (A) ApoE -/- and CT mice. Eleven mice at the age of 20 weeks were used in each group. C57/BL6 mice on rodent chaw were used as CT. ApoE -/- mice were fed a high-fat diet for 8 weeks. (B) Gating and sorting strategy to isolate Ly6Chigh and Ly6Clow MC. Mouse white blood cell were prepared from peripheral blood, pooled, stained with antibody against CD11b, Ly6G and Ly6C and subjected for flow cytometry cell sorting. CD11b+Ly6G- cells were characterized as MC. MC subsets (CD11b+Ly6G-Ly6Chigh, and CD11b+Ly6G-Ly6Clow) were sorted and used for bulk RNA-seq analysis. (C) MC subsets yield by cell sorting. MC (100,000 cells) were sorted by flow cytometry with 43.7% Ly6Chigh, 23.7% Ly6Cmiddle and 32.3% Ly6Clow MC from ApoE -/- mice, and 30.3% Ly6Chigh, 33.1% Ly6Cmiddle and 36% Ly6Clow MC in CT mice. The detail of flow cytometry sorting cell subset was presented in Supplementary Figure 1 . (D) Principal component analysis. PCA analysis incorporated 8 samples from 4 groups of MC subsets {Ly6Chigh (CT), Ly6Clow (CT), Ly6Chigh (ApoE-/- ) and Ly6Clow (ApoE-/- )}. (E) Hierarchical cluster analysis. The similarity of gene expression between different samples is represented by the vertical distances on each branch of the dendrogram. Biological replicates show the highest degree of correlation within samples, represented by short vertical distances. (F) Comparison strategy to identified SDE genes. Four group comparisons (A–D) were performed. Down-regulated and up-regulated SDE genes were identified using the criteria of |Log2FC| more than 1 (2-FC) and adjusted P value less than 0.01. (G) Heatmap of SDE gene in 4 comparison groups. Heatmap shows the expression levels of the SDE gene in Ly6C MC. The color density indicates the average expression of a given gene normalized by z-score. (H) Overlap analysis for SDE gene. Venn diagram summarized the total SDE genes from four pairs of comparisons. Numbers depict the amount of SDE genes. (I) ApoE mRNA levels. MC, monocyte; CT, wild type; ApoE, Apolipoprotein E; FACS, fluorescent-activated cell sorting; PCA, principal component analysis; PC, principal component; SDE, significantly differentially expressed; FC, fold change. *P < 0.05.

