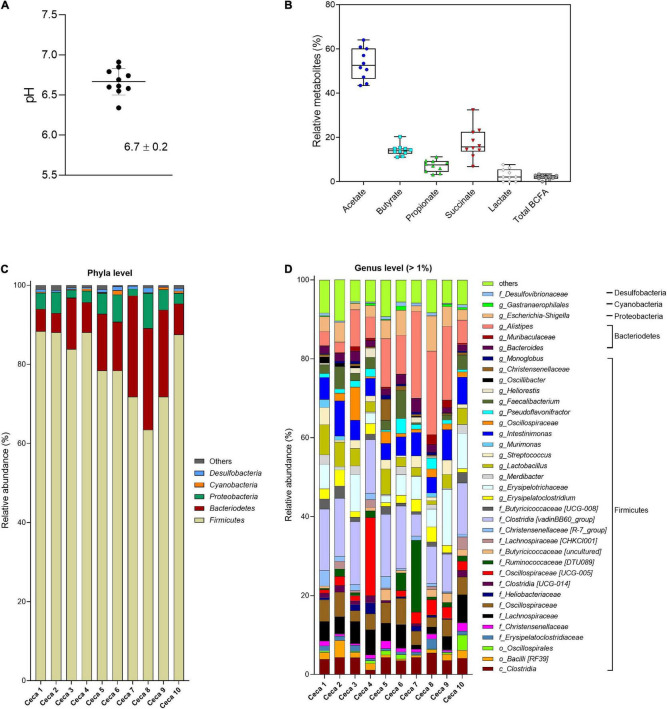
FIGURE 2.
Analysis of cecal content of Cobb-500 broiler chicken (mean ± standard deviation; n = 10). (A) pH; (B) relative metabolite concentrations (%); (C) microbial composition obtained by 16S rRNA gene amplicon sequencing and expressed as relative abundance at phylum; and (D) genus level. When the genus assignment was not possible, the highest-level taxonomy assignment was shown. Values < 1% are summarized in the group “others”.

