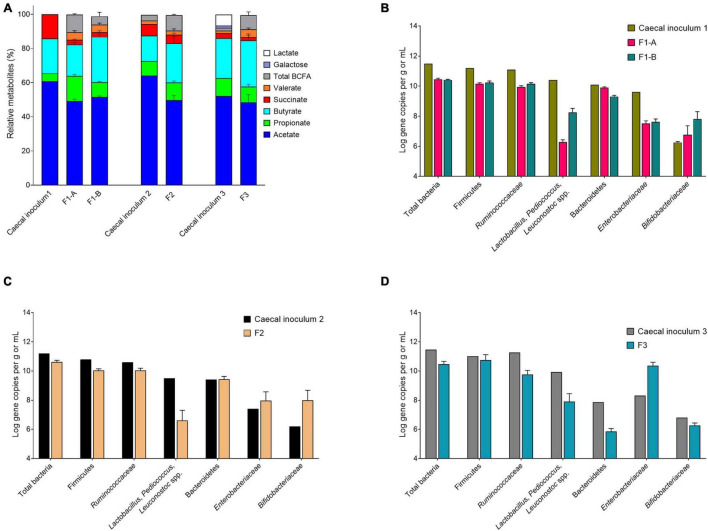
FIGURE 3.
Metabolite and microbial compositions in the cecal inocula and reactor effluents of different fermentations after initial stabilization. (A) Relative metabolite ratios and standard deviation (%). (B–D) Quantification of bacterial populations by qPCR, expressed as mean ± SD log gene copies/g or mL.

