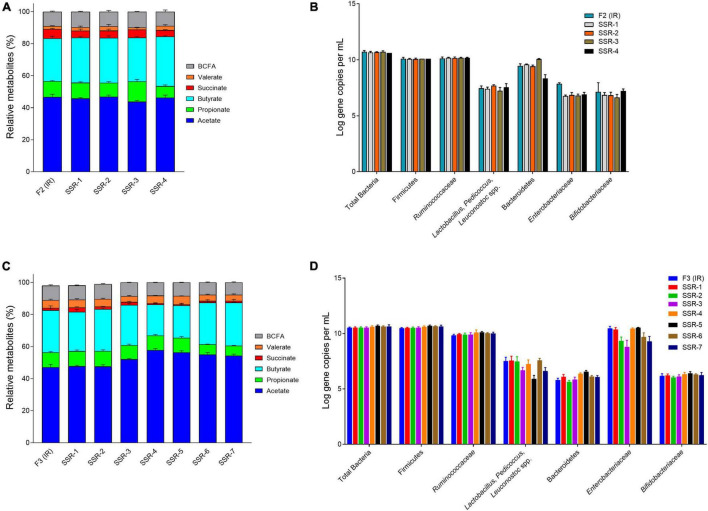
FIGURE 6.
Bacterial activity and composition of inoculum reactor (IR) and second-stage reactors (SSR) after initial stabilization estimated from days 6–10 in period 1. Relative metabolite with standard deviation of F2 (A) and F3 (C). Quantification of key bacterial populations by qPCR, expressed as mean ± SD log gene copies/g cecal content or mL effluent of F2 (B) and F3 (D).

