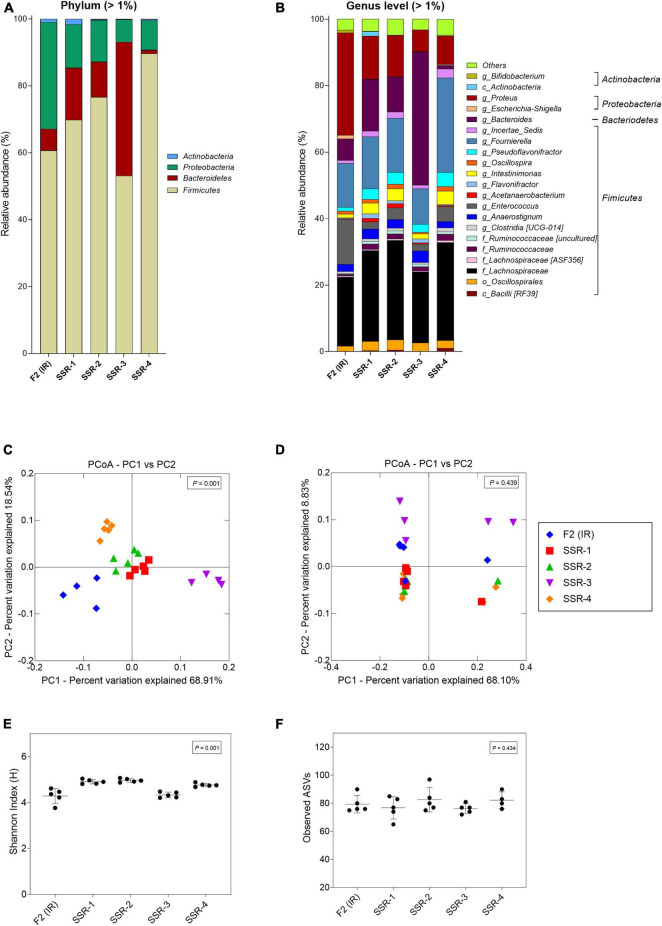
FIGURE 7.
Microbial composition and diversity in the inoculum reactor (IR) and four second-stage reactors (SSR) of F2 after initial stabilization and estimated from days 6–10 in period 1. (A,B) Microbial composition by 16S rRNA amplicon sequencing represented by relative abundance at phylum (A) and genus levels (B). When the genus assignment was not possible, the highest-level taxonomy assignment was shown. Values < 1% are summarized in the group “others”. (C,D) Principal coordinate analysis (PCoA) of reactor microbiota based on weighted (C) and unweighted (D) UniFrac analysis matrix. α-Diversity measured by (E) Shannon index and (F) observed ASVs.

