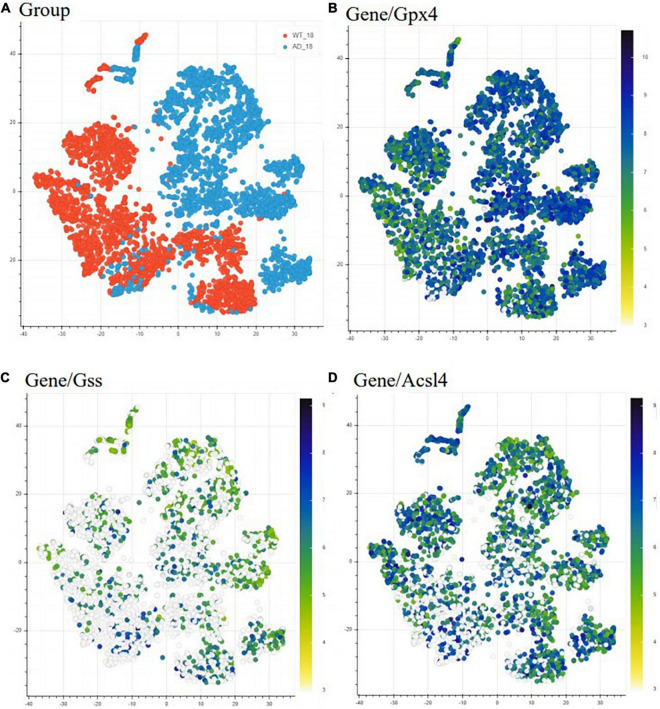
FIGURE 2.
Differential expression of ferroptosis related genes in AD mice model compared to WT mice. Heatmap representing the difference in expression of ferroptosis-related genes between 18 months old WT (orange) and AD mice (light blue) (A). The heatmap depicts gene expression from low/white to high/dark blue. Each point indicates one spatial transcriptomic spot defining one tissue domain on the slide. Glutathione peroxidase 4 (Gpx4) is upregulated with pathology (B), while glutathione synthase (Gss) (C) and acyl-CoA synthetase long-chain family member (Acsl4) (D) are downregulated with the pathology. This data is freely accessible online, Alzmap (Chen et al., 2020).

