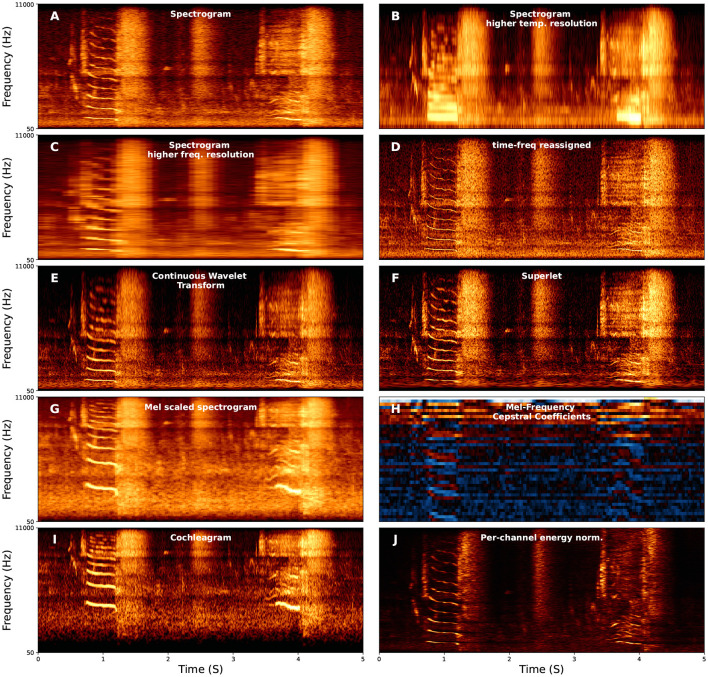
Figure 2.
Examples of several different spectral representations of a five-second red deer (Cervus elaphus) vocalization. For each axis, the x-axis corresponds to time, and the y-axis corresponds to frequency. The y-axis corresponds to frequency and is linearly spaced in (A–F,J) between 50 and 11,000 Hz and log-spaced in the same range for (G–I). (F) Continuous Wavelet Transform using the Morlet (i.e., Gabor) wavelet.

