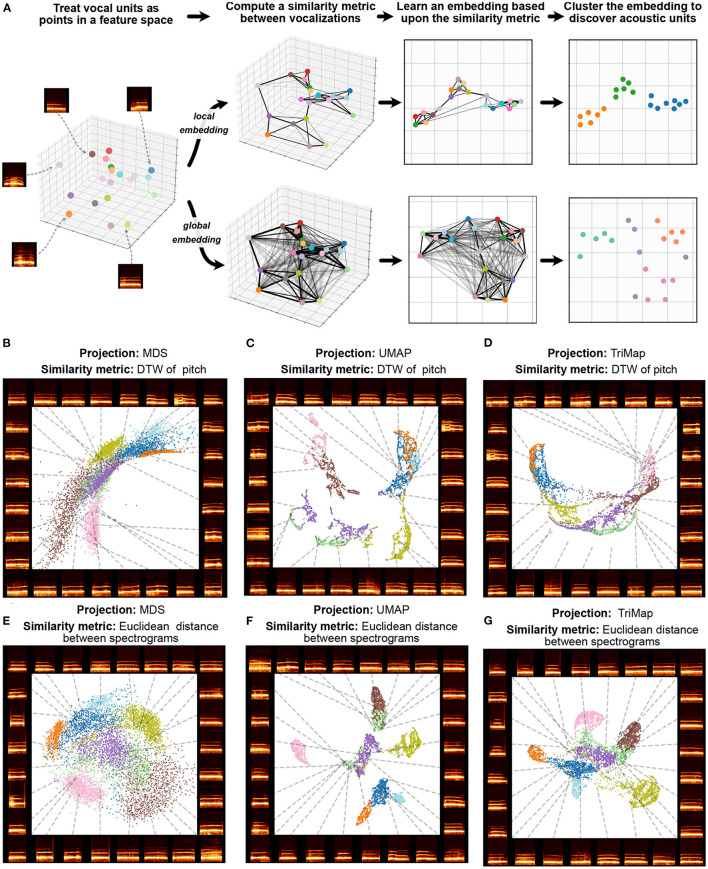
Figure 4.
Local and global embeddings. (A) The steps outlined in Section 5 exhibit the differences between the relationships preserved in local and global embeddings. (B–D) Projections of a dataset of macaque coo calls (Fukushima et al., 2015) using two similarity metrics (Dynamic Time Warping over frequency, and Euclidean distance between spectrograms) and three projection algorithms (Multidimensional Scaling, UMAP, and TriMap) (E–G). Colors represent individual identity.

