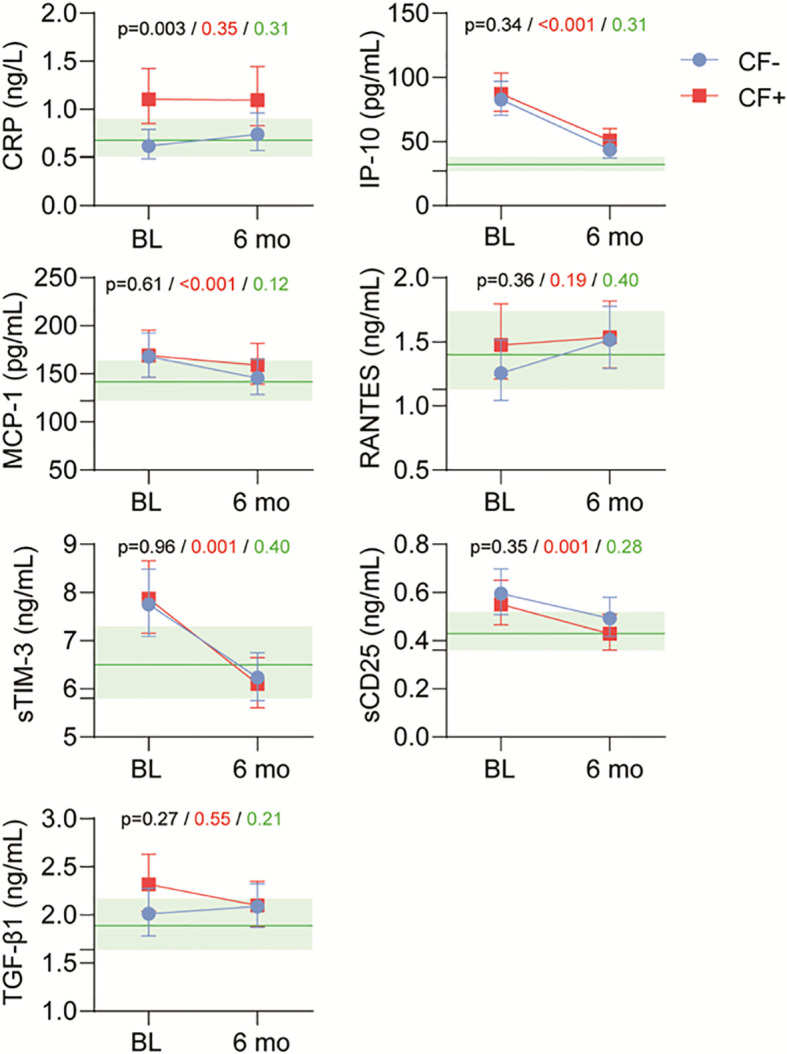
Figure 3.

Plasma levels of cytokines and inflammatory markers in healthy controls (HC) and EBV patients with and without fatigue (CF+ and CF-, respectively) at baseline and after 6 months. Black p-value group effect, CF+ vs CF- irrespective of time. Red p-value time effect irrespective of group. Green p-value interaction of time vs group. Levels of controls with 95% CI marked in light green.
