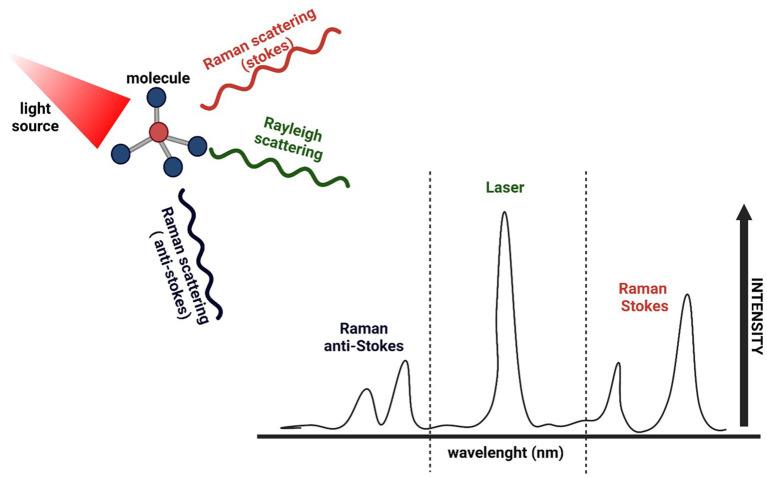
Figure 2.
Schematic representation of Raman spectroscopy. After the sample (molecule) is exposed to an intense beam of monochromatic light in the frequency range of visible, near-infrared or near-ultraviolet region, most of the scattered light is at the same wavelength as the laser source (Rayleigh scattering). In contrast, a small amount of light is scattered at different wavelengths depending on the chemical structure of the analyte (Raman scattering). A Raman spectrum is a vibrational spectrum, where each peak corresponds to a specific molecular bond vibration, showing the intensity and wavelength position of the Raman scattered light.

