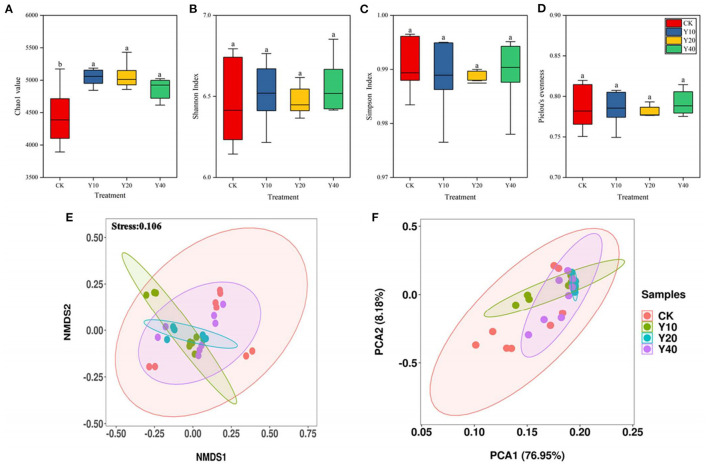
Figure 1.
Alpha diversity of 16S rRNA gene sequencing data among groups CK, Y10, Y20 and Y40. (A) Chao1 value, (B) Shannon Index, (C) Simpson Index, (D) Pielou's evenness. Results are means of eight replicates. Different letter means the significant difference (P < 0.05). The non-metric multidimensional scaling (NMDS) (E) and principal component analysis (PCA) (F) plots of soil bacterial community beta diversity.

