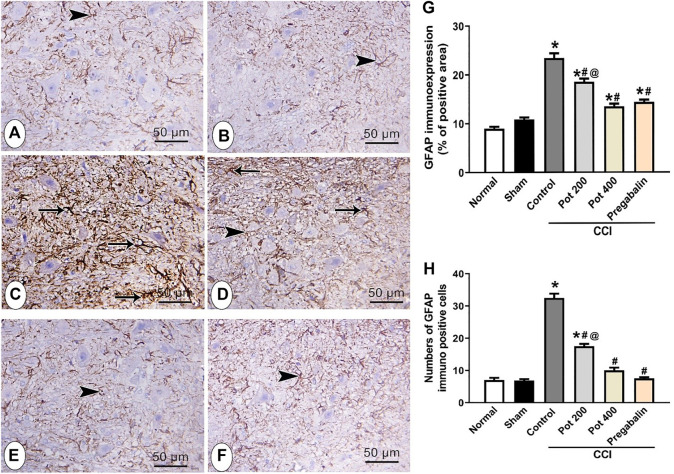
FIGURE 10.
Microscopic images identify the immunoreactivity of the astrocyte marker GFAP in brainstem in different studied groups (A) control group; (B) sham group (C) CCI group; (D) CCI + P. perfoliatus extract (Pot, 200 mg/kg, p.o) (E) CCI + P. perfoliatus extract (Pot, 400 mg/kg, p.o) (F) CCI + pregabalin. Arrow refers to the astrocytes with thick branching and over expression of GFAP and arrowhead refers to the thin branching astrocytes. Scale bar; 50 μm. (G,H) Bar charts showing changes in the area percent of GFAP-immuno-expression and the number of GFAP-positive cells, respectively (G) Bar chart showing the difference in the area percent of GFAP-immuno-expression in all studied groups that were measured from six animals/group in perceptive fields at ×400 magnification. One-way ANOVA was used for statistical analysis followed by a post-hoc Tukey test. Values are presented as means ± SEM.*p < 0.05 vs control group; #p < 0.05 vs CCI.

