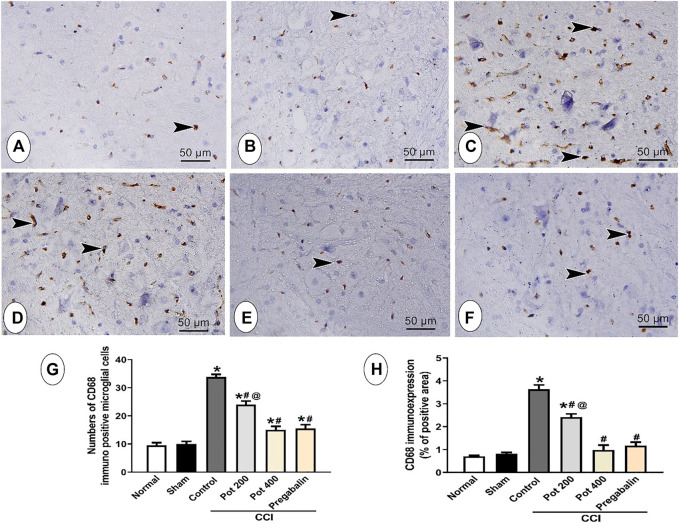
FIGURE 9.
Microscopic images identify the immunoreactivity of the microglial marker CD68 in the brainstem of different studied groups (A) control group; (B) sham group (C) CCI group; (D) CCI + P. perfoliatus extract (Pot, 200 mg/kg, p.o) (E) CCI + P. perfoliatus extract (Pot, 400 mg/kg, p.o) (F) CCI + pregabalin. Arrowheads refer to the dark brown microglial cells. Scale bar; 50 μm. (G,H) Bar charts showing changes in the number of CD68 positive cells and the area percent of CD68 immuno-expression, respectively that were measured from six animals/group in perceptive fields at ×400 magnification. One-way ANOVA was used for statistical analysis followed by a post-hoc Tukey test. Values are presented as means ± SEM. *p < 0.05 vs control group; # p < 0.05 vs CCI.

