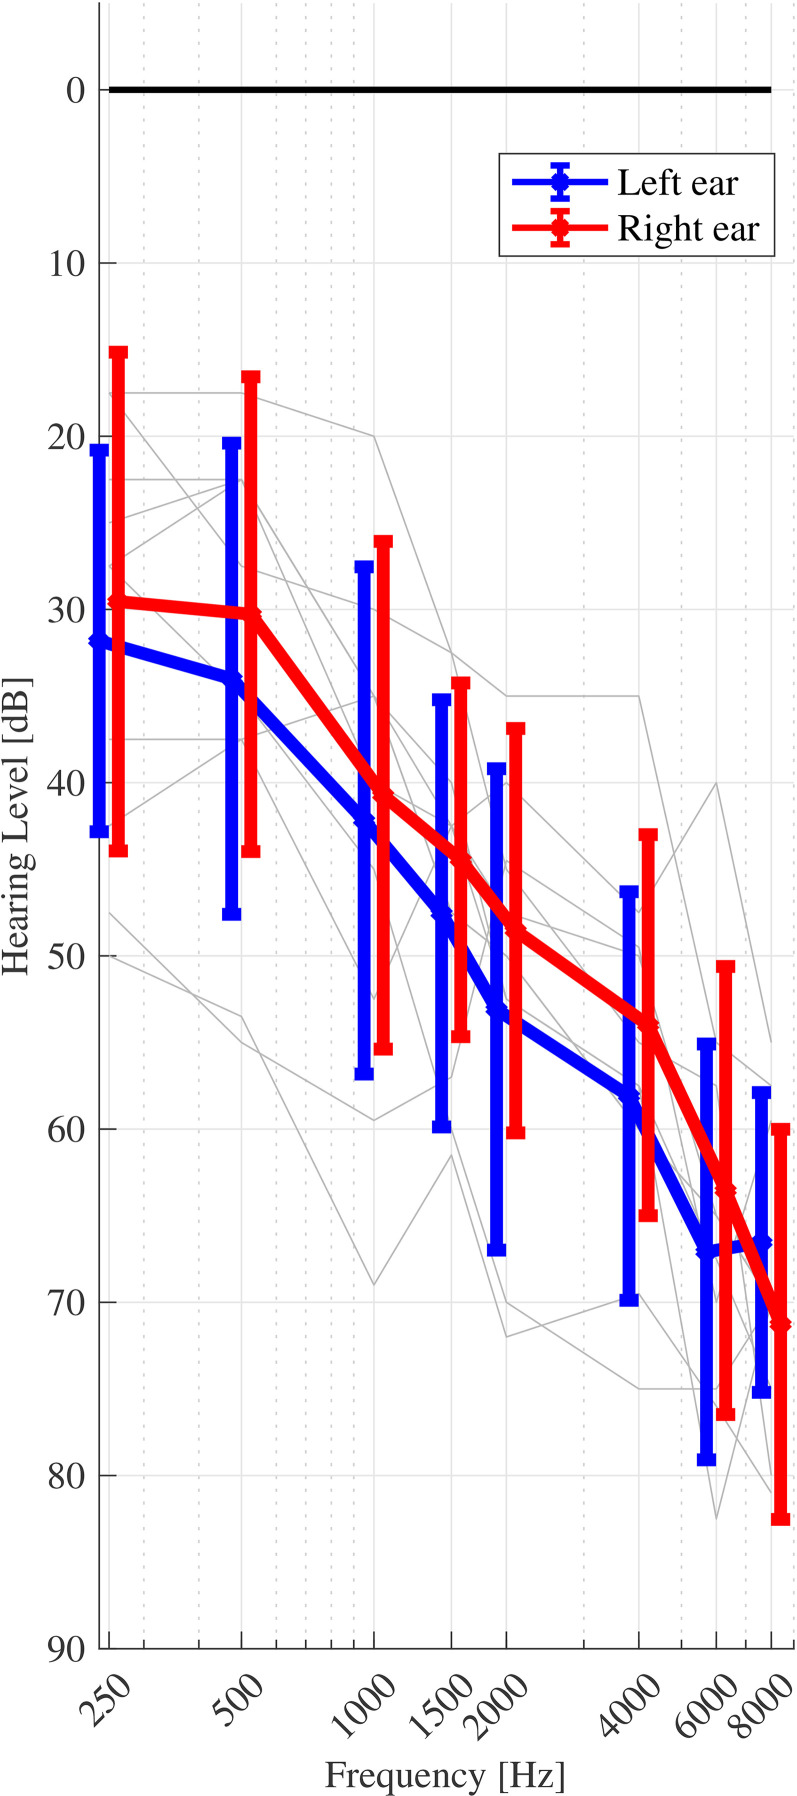
Figure 1.
Pure-tone audiometric thresholds for all HI listeners. The mean and standard deviation across listeners are shown by the bold markers and error bars, respectively. Left and right ears are indicated by blue and red lines, respectively. Individual listeners’ thresholds (averaged across left and right ears) are indicated by the grey lines.

