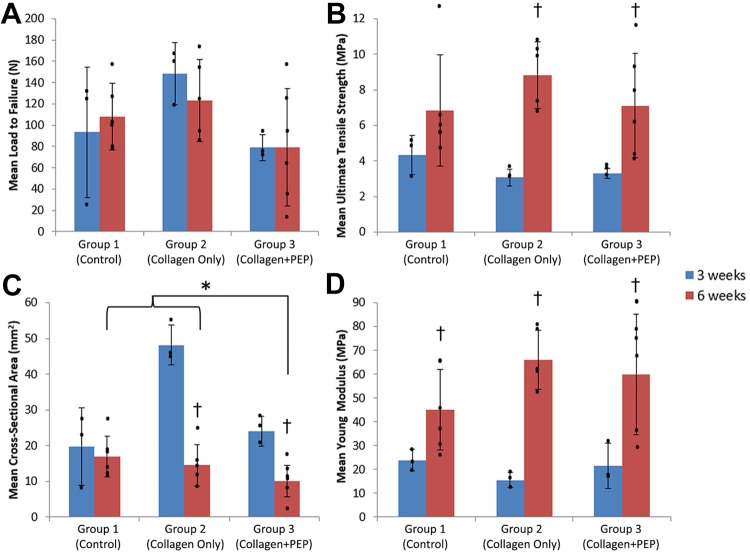
Figure 3.
(A) Load to failure and (B) ultimate tensile stress at 3 and 6 weeks for each group showed no significant difference between groups, although ultimate tensile stress increased significantly over time in groups 2 and 3 († P < .05). (C) Cross-sectional area decreased significantly in the purified exosome product (PEP)–treated group by 6 weeks (* P = .04). (D) The Young modulus increased over time for all groups († P ≤ .03). Dots indicate individual values; error bars indicate SDs.

