Figure 5.
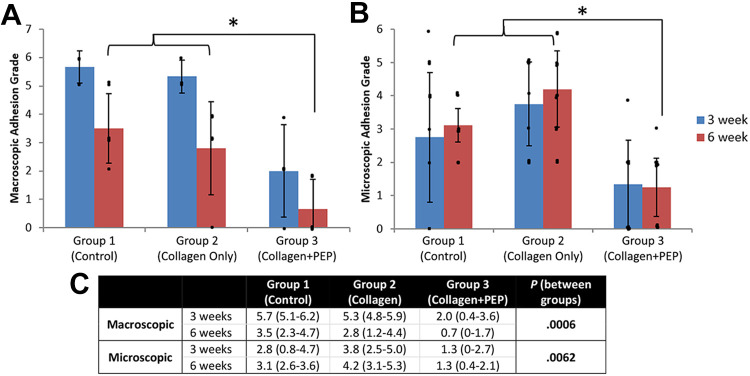
Mean (A) macroscopic and (B) microscopic adhesion grades at 3 and 6 weeks for each group, according to the grading criteria of Tang et al. 38 Group 3 demonstrated significantly lower adhesion grade both macroscopically (*P = .0006) and microscopically (*P = .0062). Dots indicate individual values; error bars indicate SDs. (C) Data in tabular format. PEP, purified exosome product.

