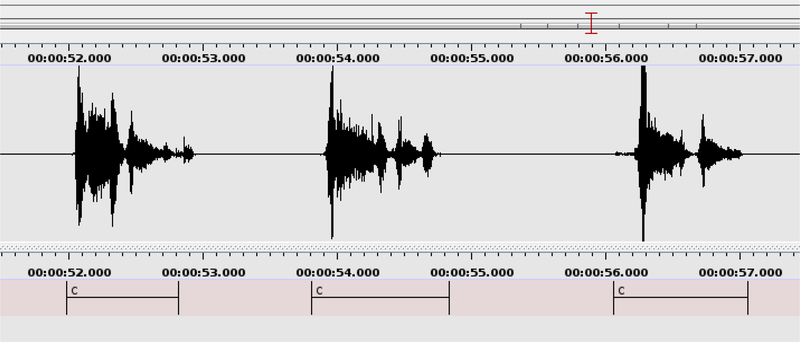
Figure 3: Cough annotation process:
The start and end times of all cough events were manually annotated by the label ‘c’ in the audio recording using the ELAN software. This figure shows the manual annotation of three consecutive cough events. The three labelled cough events include two, three and two individual cough onsets respectively. The manual annotation process indicated the start and the end times of audio containing coughing, but did not label such onsets. However, it revealed that the average number of such onsets is almost equal across the TB and non-TB classes. Each manually annotated cough event was subsequently automatically divided into sections, as described in Section 3.5.

