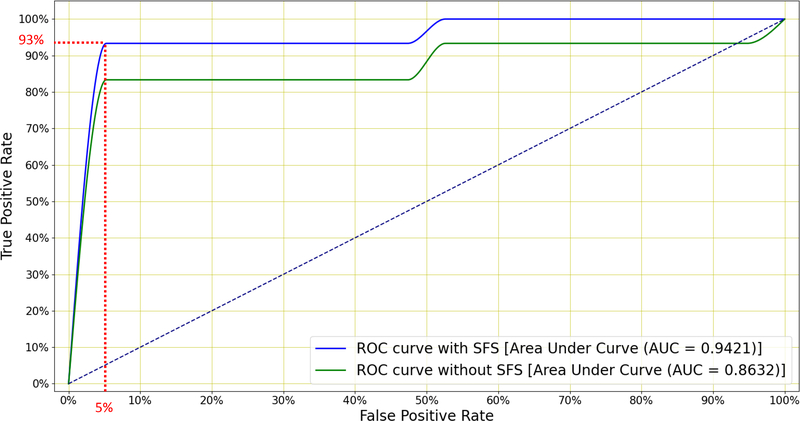
Figure 9:
Mean ROC curves for the LR classifier when distinguishing between TB and non-TB patients with and without SFS (Figure 8). The former uses all 78 features while the latter retains only the 23 best features. A sensitivity of 93% is achieved at 95% specificity and this exceeds the minimum WHO specification for community-based TB triage testing.

