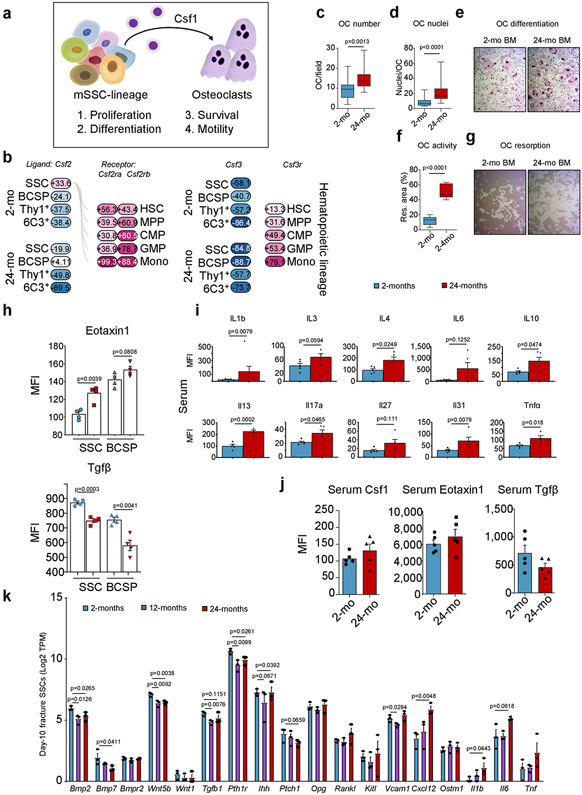
Extended Data Fig. 7 ∣. Skeletal-lineage-derived CSF1 promotes bone resorption with age.
a, Model of SSC-lineage-derived CSF1 actions as described in the literature for osteoclast function. b, Ligand (Csf2 or Csf3) and receptor (Csf2r or Csf3r) bulk microarray gene expression (%) in the 2-month-old and 24-month-old SSC lineage and in the haematopoietic lineage, respectively. c, Quantification of the number of in-vitro-cultured osteoclasts derived from the bone marrow of 2-month-old and 24-month-old mice (2-mo, n = 16; 24-mo, n = 18, number per field of view, from three mice per age group). d, Number of nuclei per derived osteoclast (n = 14 per age group). e, Representative bright-field images of in-vitro-derived osteoclasts. f, Quantification of in vitro resorption activity of bone-marrow-derived osteoclasts from the bone marrow of 2-month-old and 24-month-old mice (n = 5 wells with cells from two different mice per age). g, Representative bright-field images in the same experiment. h, Luminex protein data of eotaxin1 and TGFβ in the supernatant of SSC and BCSP cultures of 2-month-old and 24-month-old mice (n = 4 per age group). Statistical testing by two-sided Student’s t-test. i, Blood serum concentrations of selected inflammatory markers in 2-month-old and 24-month-old mouse blood (n = 4-5 per age). Statistical testing by two-sided Student’s t-test.j, Blood serum concentrations of CSF1, eotaxin1 and TGFβ in the circulation of 2-month-old and 24-month-old mice (n = 5 per age). Statistical testing by two-sided Student’s t-test. k, Gene expression of pro-haematopoietic or pro-osteoclastic and pro-osteogenic genes in bulk RNA-sequencing data of SSCs of day-10 fracture calluses from 2-month-old, 12-month-old and 24-month-old mice (n = 3 per age). One-sided Student’s t-test of ageing groups versus 2-month-old group. All data in scatter plots are mean + s.e.m., except c, d, f, which show box-and-whisker plots with centre line as median, box extending from 25th to 75th percentile and minimum to maximum values for whiskers. For exact P values, see Source Data.

