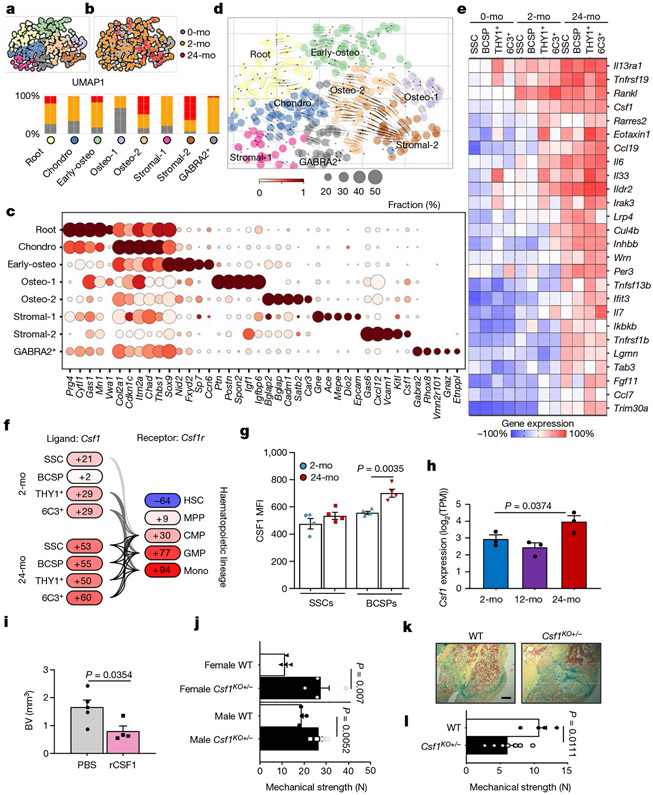
Fig. 3 ∣. A pro-inflammatory aged skeletal lineage drives enhanced osteoclastic activity through CSF1.
a, Uniform manifold approximation and projection (UMAP) plot showing Leiden clusters from combined Smart-seq2 scRNA-seq of single cells from postnatal day 3 (0-month-old), 2-month-old and 24-month-old mice. b, Clustering of the same UMAP plot by age (top), showing the distribution within Leiden clusters (bottom) of sequenced single cells by age. c, Dot plot showing marker genes for each Leiden cluster. d, RNA velocity trajectory inference analysis with cells labelled by Leiden cluster. e, Heat map of bulk microarray data for the expression of pro-inflammatory and pro-myeloid or pro-osteoclastic genes of purified skeletal lineage populations. Wisp3 is also known as Ccn6. Each cell population reflects the expression of a pooled sample of three to five mice. f, Ligand (Csf1) and receptor (Csf1r) microarray bulk gene expression (in percentage) in the 2-month-old and 24-month-old SSC lineage and in the haematopoietic lineage, respectively. MPP, multipotent progenitor; CMP, common myeloid progenitor; mono, monocyte. g, Levels of CSF1 protein measured by Luminex assay in the supernatant of SSC and BCSP cultures from 2-month-old and 24-month-old mice (n = 4 per group). MFI, median fluorescence intensity. h, Csf1 expression in bulk RNA-sequencing data of purified SSCs of day-10 fracture calluses from 2-month-old, 12-month-old and 24-month-old mice (n = 3 per age). TPM, transcripts per million. One-sided Student’s t-test to compare ageing groups to the 2-month-old group. i, μCT analysis of bone volume (BV) of day-10 fracture calluses that were locally treated with PBS or 5 μg of recombinant CSF1 (rCSF1) (PBS, n = 5; rCSF1, n = 4). j, Mechanical strength of uninjured femur bones from 15-month-old haplo-insufficient Csf1-knockout (Csf1KO) mice versus wild-type (WT) mice (n = 4 per group). k, l, Movat’s pentachrome staining of day-21 fracture callus tissue (k) and mechanical strength of the same calluses (l) from 15-month-old Csf1KO and wild-type mice (wild type, n = 4; Csf1KO, n = 7). Two-sided Student’s t-test adjusted for unequal variances (Welch’s test) where appropriate (g, i, j, l). Data are mean + s.e.m. For exact P values, see Source Data. Scale bar, 150 μm.

