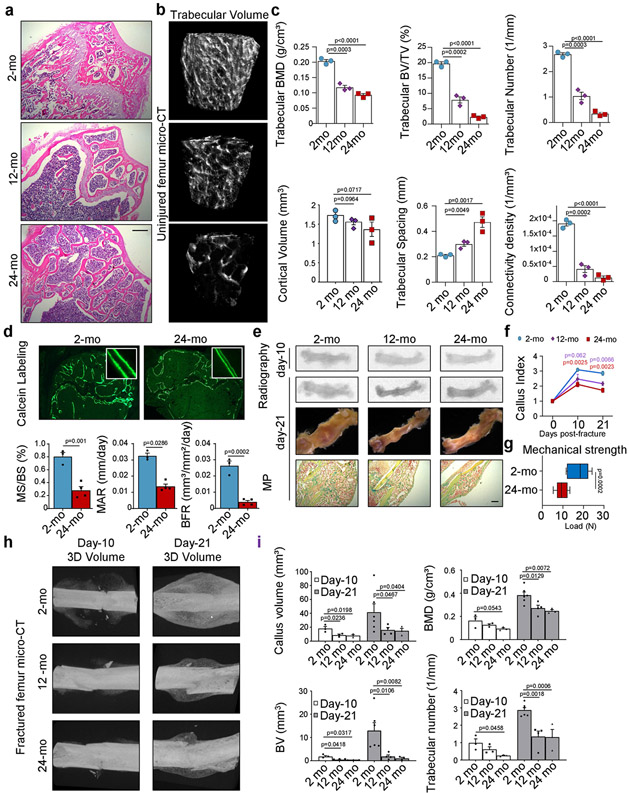
Extended Data Fig. 1 ∣. Ageing alters bone physiology and fracture healing in mice.
a, Representative haematoxylin and eosin (H&E) staining of proximal femurs from 2-month-old, 12-month-old and 24-month-old mice (representative of sections from three independent mice per age group). b, Three-dimensional μCT reconstruction of femoral bone mass in 2-month-old, 12-month-old and 24-month-old mice. c, Quantification of bone parameters by μCT measurements in the three age groups (n = 3 per age group). d, Bone formation rate (BFR) assessment by calcein labelling in 2-month-old and 24-month-old mice (n = 3 per age group). MS, mineralizing surface; BS, bone surface; MAR: mineral apposition rate. e, Radiograph, μCT, and Movat’s pentachrome staining images of fracture calluses at day 10 and day 21 after injury. f, Callus index measurements at day 10 and day 21 after fracture in femurs from 2-month-old, 12-month-old and 24-month-old mice (day 10 12-mo, n = 5; all other groups, n = 3). g, Mechanical strength test of fracture calluses at day 21 after fracture (2-mo, n = 10; 24-mo, n = 8). Box-and-whisker plots with centre line as median, box extending from 25th to 75th percentile and minimum to maximum values for whiskers. h, μCT images of fracture calluses from 2-month-old, 12-month-old and 24-month-old mouse femurs at day 10 and day 21 after injury. i, Quantification of fracture callus parameters by μCT measurements in the three age groups (n = 3–6). All scatter plot data are mean + s.e.m. One-sided Student’s t-test for comparison of ageing groups to the 2-month-old group, adjusted for non-normality (Mann–Whitney test) or unequal variances (Welch’s test) where appropriate. For exact P values, see Source Data. Scale bars, 150 μm.

