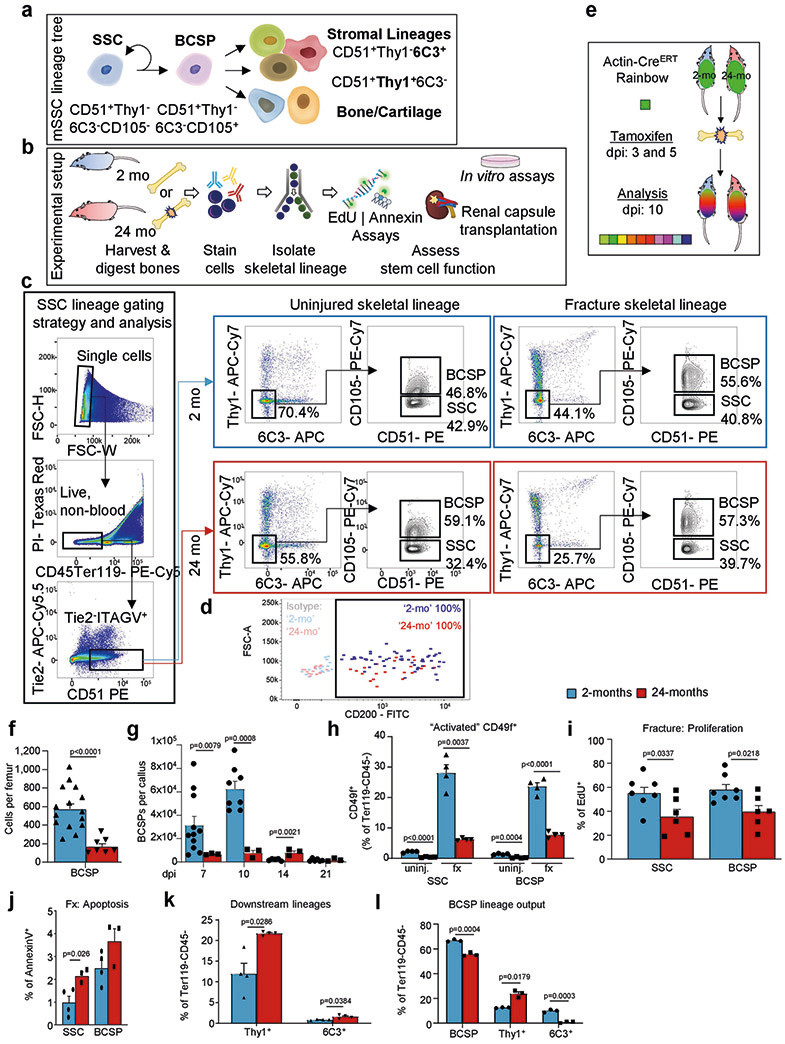
Extended Data Fig. 2 ∣. Phenotypic SSCs are present in aged mice.
a, The mouse skeletal stem-cell lineage. A self-renewing SSC gives rise to a BCSP cell which is the precursor for committed cartilage, bone and stromal lineages. b, Schematic of experimental strategy to analyse intrinsic characteristics of highly purified SSC lineage cells from 2-month-old or 24-month-old mice. c, FACS gating strategy for the isolation of mouse SSC lineage cells. Representative FACS profiles for 2-month-old and 24-month-old mice are shown during the uninjured state and the day-10 fracture state. d, CD200 expression of SSC gated cells in 2-month-old (blue) and 24-month-old (red) mice. Isotype controls performed on SSCs from 2-month-old or 24-month-old mice are shown for gating of the CD200-positive fraction. e, Schematic representation of the experimental set-up investigating clonal activity in fractures of 2-month-old or 24-month-old Actin-CreERT Rainbow mice (dpi, days post-injury). f, Flow cytometric quantification of BCSPs per uninjured femur (2-mo, n = 15; 24-mo, n = 7). g, Prevalence of BCSPs at different days after fracture injury in 2-month-old and 24-month-old mice (2-mo, n = 5-11; 24-mo, n = 3). h, Flow cytometric analysis of CD49f+ phenotypic SSCs and BCSPs under uninjured (uninj.) and fractured (fx; day 10) conditions in 2-month-old and 24-month-old mice (n = 4 per state, age and population). i, Proliferative activity within SSCs and BCSPs at day 10 after fracture as measured by EdU incorporation (2-mo, n = 7; 24-mo, n = 6).j, Assessment of apoptotic activity within SSCs and BCSPs at day 10 after fracture as measured by Annexin V staining (2-mo, n = 4; 24-mo, n = 3). k, Flow cytometric quantification of THY1+ and 6C3+ downstream cell population frequency in 2-month-old and 24-month-old mice in response to fracture at day 10 after injury (n = 4 per age). l, Flow cytometric analysis of the lineage output of BCSPs freshly isolated from 2-month-old and 24-month-old mice and cultured for six days (n = 3 per age). Comparison of 2-month-old and 24-month-old age groups by two-sided Student’s t-test adjusted for non-normality (Mann-Whitney test) or unequal variances (Welch’s test) where appropriate. Data are mean + s.e.m. For exact P values, see Source Data.

