Figure 3.

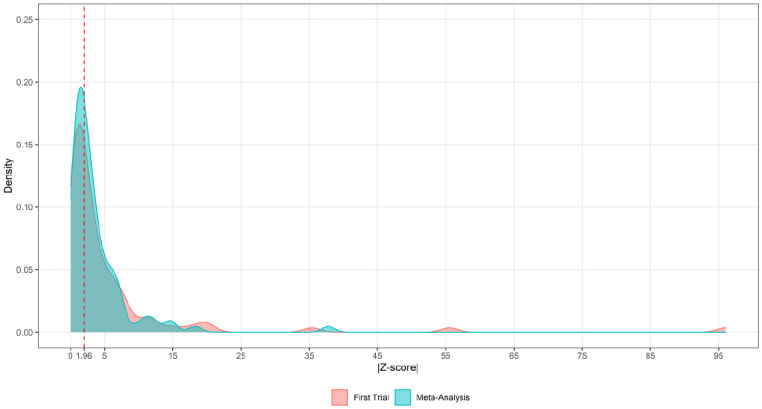
Density plot of the absolute z values of the Wald statistic between the first trial and the meta-analysis. The dotted line indicates the absolute z value with an equal likelihood of being observed in the meta-analysis and the first trial.

Density plot of the absolute z values of the Wald statistic between the first trial and the meta-analysis. The dotted line indicates the absolute z value with an equal likelihood of being observed in the meta-analysis and the first trial.