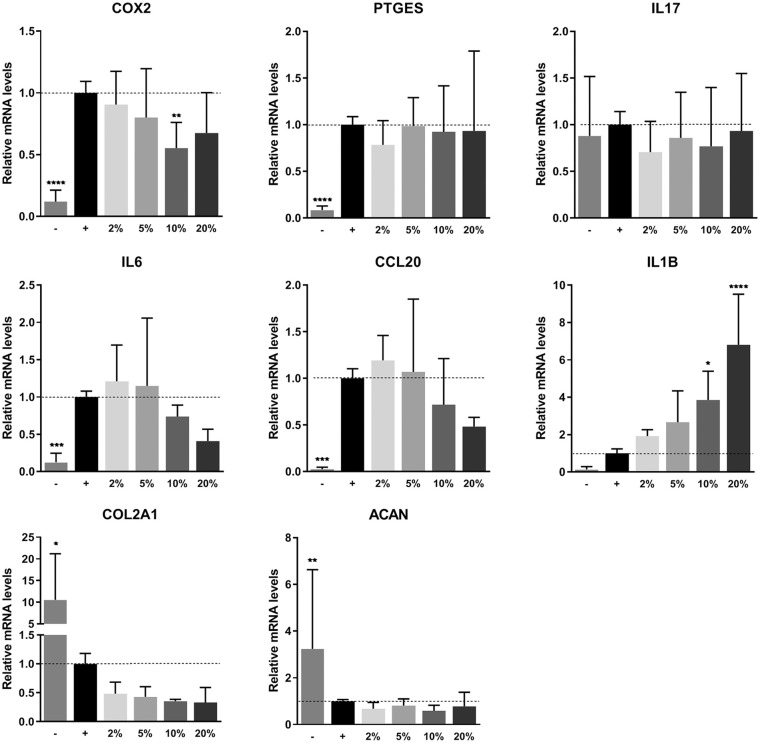
Figure 3.
Gene expression on inflammation. Gene expression of chondrocyte monolayers as measured by real-time polymerase chain reaction. Monolayers were stimulated with 10 ng/mL TNF-α and PRP for 48 hours. Gene expression was normalized for 18S. Data are presented as fold changes relative to the TNF-α stimulated control group and shown as mean ± SD. ***P < 0.001, ****P < 0.0001. PRP, platelet-rich plasma; TNF-α, tumor necrosis factor-α; COX2, cyclooxygenase 2; PTGES, prostaglandin E synthase; IL17, interleukin 17; IL6, interleukin 6; CCL20, C-C motif chemokine ligand 20; IL1B, interleukin 1B; COL2A1, collagen type II alpha 1 chain; ACAN, aggrecan.

