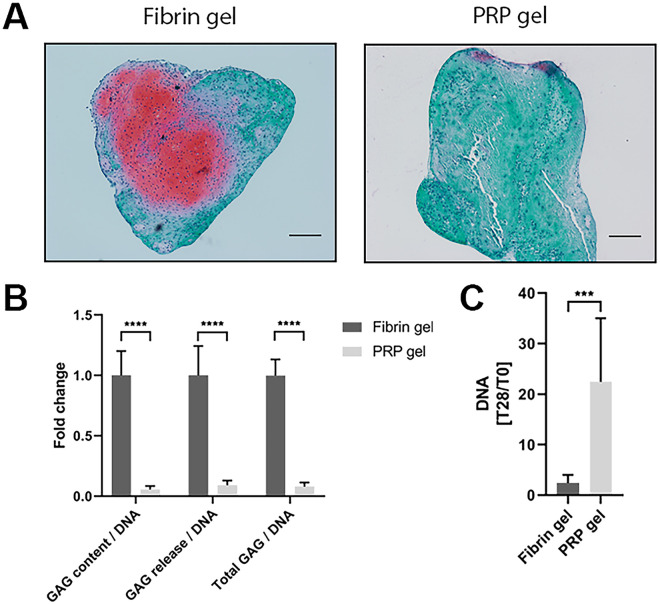
Figure 5.
Proteoglycan production and proliferation in platelet-rich plasma (PRP) gel. Proteoglycans were visualized in PRP gels as well as control fibrin gels by safranin-O staining. Scale bar = 200 µm (A). Quantification of data presented in A. Production of glycosaminoglycans (GAGs) was normalized for DNA content and presented as fold change to the fibrin gel control group. Data are shown as mean ± SD. ****P < 0.0001 (B). Increase in DNA content in fibrin and PRP gels over the culture period of 28 days. Data are depicted as mean ± SD. ***P < 0.001 (C).

