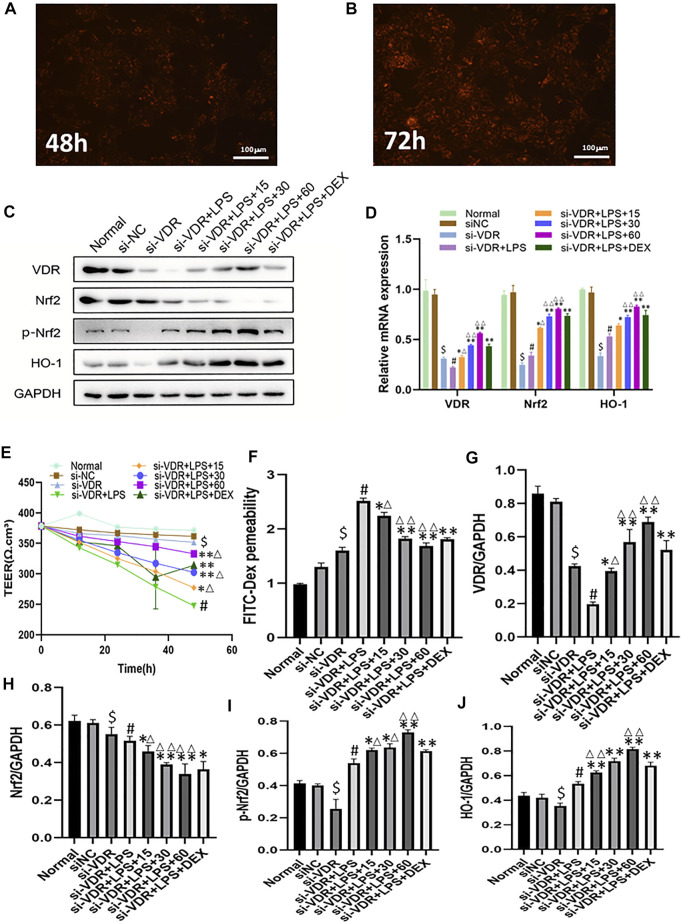
FIGURE 2.
(A-B) The expression of VDR was observed with a fluorescence microscope after siRNA was introduced into NCM460 cells for 48 h and 72 h (C)The protein levels of VDR, Nrf2, p-Nrf2, HO-1 molecules were detected by western blotting. (D) The mRNA levels of above molecules were detected by RT -PCR. (E–F) Transepithelial resistance (TEER) and FITC-Dextran 4 kDa flux were measured to assess monolayer permeability. (G–J) Quantitative results of VDR and its downstream protein expression. $ p < 0.05 compared with the normal group; # p < 0.05 vs si-VDR group; ∗ p < 0.05,∗∗ p < 0.01 vs si-VDR + LPS group; ∆ p < 0.05, ∆∆ p < 0.01, compared with the DEX group. si-VDR: VDR was knocked down in NCM460 cells by siRNA. si-NC: SiRNA negative control group.

