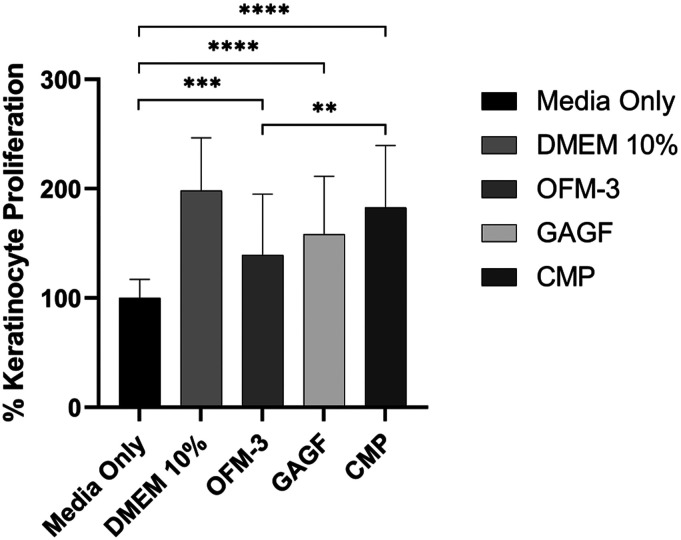
Figure 8.
In vitro human keratinocyte proliferation. Quantification of average percent change in proliferation, relative to the media-only control. Error bars represent standard deviation from triplicate independent experiments with n = 6 sample replicates per experiment. ***, p = .0001; ****, p < .0001 relative to the media only control; **, p < .01 CMP sample versus OFM-3 sample. OFM: Ovine forestomach matrix-3; CMP: composite samples.

