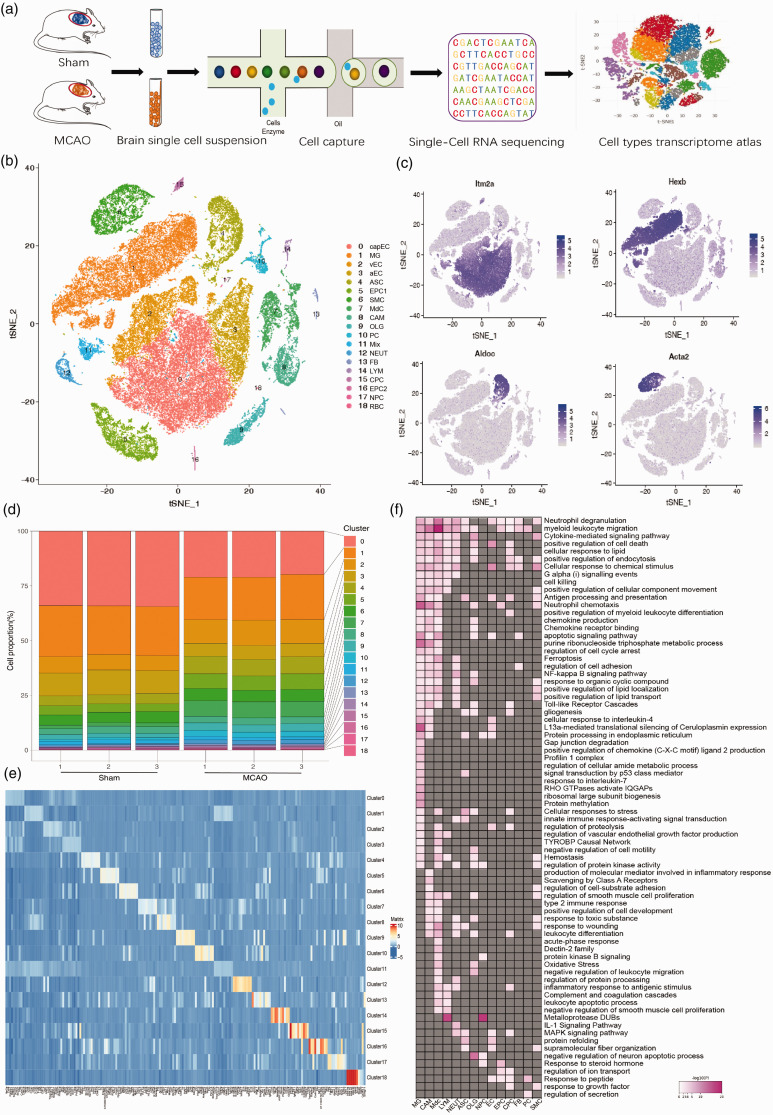
Figure 1.
Single-cell RNA sequencing of mouse brain recapitulates transcriptome atlas in ischemic stroke. (a) Graphical diagram of single cell isolation and RNA-seq experimental setup. (b) t-SNE plot visualizing clustering of single cells colored by cell types. (c) t-SNE plots visualizing the expression distribution of a set of selected marker genes, including Itm2a, Hexb, Aldoc, and Acta2. (d) Bar plot of the proportion of cells in each sample for each cell cluster identified. (e) Heatmap representing the top 10 most highly expressed genes within each cluster relative to the rest of clusters. (f) The pathway and biological process analyses between MCAO and sham group for each cell type cluster. Pink color indicates upregulation, Gray indicates no significant change. vascular smooth muscle cells (SMC); perivascular fibroblast-like cells (FB); CNS boreder-associated macrophages (CAM); monocyte-derived cells (MdC); venous endothelial cells (vEC); capillary endothelial cells (capEC); arterial endothelial cells (aEC); pericytes (PC); choroid plexus epithelial cells (CPC); ependymocytes (EPC), microglia (MG); neutrophils (NEUT); astrocytes (ASC); oligodendrocytes (OLG); neural progenitor cells (NPC); lymphocytes (LYM); red blood cell (RBC).

