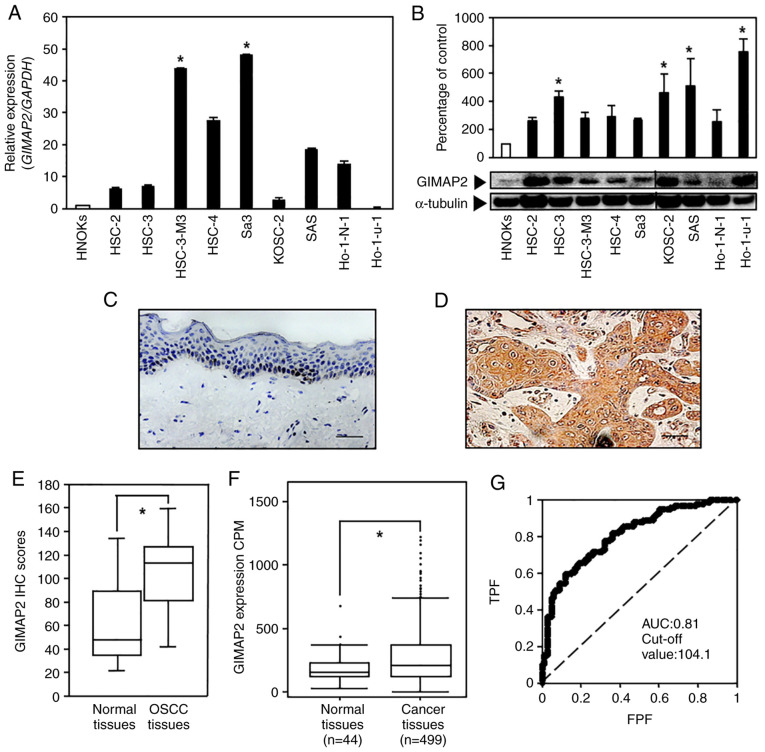
Figure 1.
Evaluation of GIMAP2 expression in OSCC-derived cell lines and primary OSCC specimens. (A) Reverse transcription-quantitative PCR analysis showed that GIMAP2 mRNA expression was significantly upregulated (*P<0.05, Dunnett's test) in the two OSCC cell lines compared with that in HNOKs. (B) Western blotting was conducted three times per cell type using GIMAP2 primer No. 1. The results are expressed as mean ± standard error of the mean of triplicate data. GIMAP2 expression was upregulated (*P<0.05, Dunnett's test) in four OSCC cell lines compared with that in HNOKs. Non-continuous parts of blots probed on the same membrane are indicated using vertical lines. Representative IHC results for GIMAP2 expression in (C) the normal oral tissues (scale bar, 50 µm) and (D) primary OSCC tissues (scale bar, 50 µm). (E) IHC scores showed GIMAP2 expression in primary OSCC (n=100) and normal tissue samples. The GIMAP2 IHC scores of the normal oral tissues and primary OSCC tissues ranged from 21.2 to 134.5 (median, 44.6) and from 30.2 to 148.0 (median, 109.8), respectively. GIMAP2 expression was considerably (*P<0.05, Wilcoxon signed-rank test) higher in OSCC tissues compared in normal oral tissues. (F) The Cancer Genome Atlas data show the GIMAP2 expression status in primary HNSCC; n=499) and normal tissue samples (n=44). GIMAP2 expression was considerably higher in HNSCC tissues than in normal tissues (*P<0.05, Student's t-test). (G) The ROC curve analysis indicated that the cut-off value was 104.1 and the AUC was 0.81. GIMAP2, GTPases of immunity-associated proteins 2; OSCC, oral squamous cell carcinoma; HNOK, human normal oral keratinocyte; IHC, immunohistochemistry; ROC, receiver operating characteristic; AUC, area under the curve; TPF, true-positive fraction; FPF, false-positive fraction.

