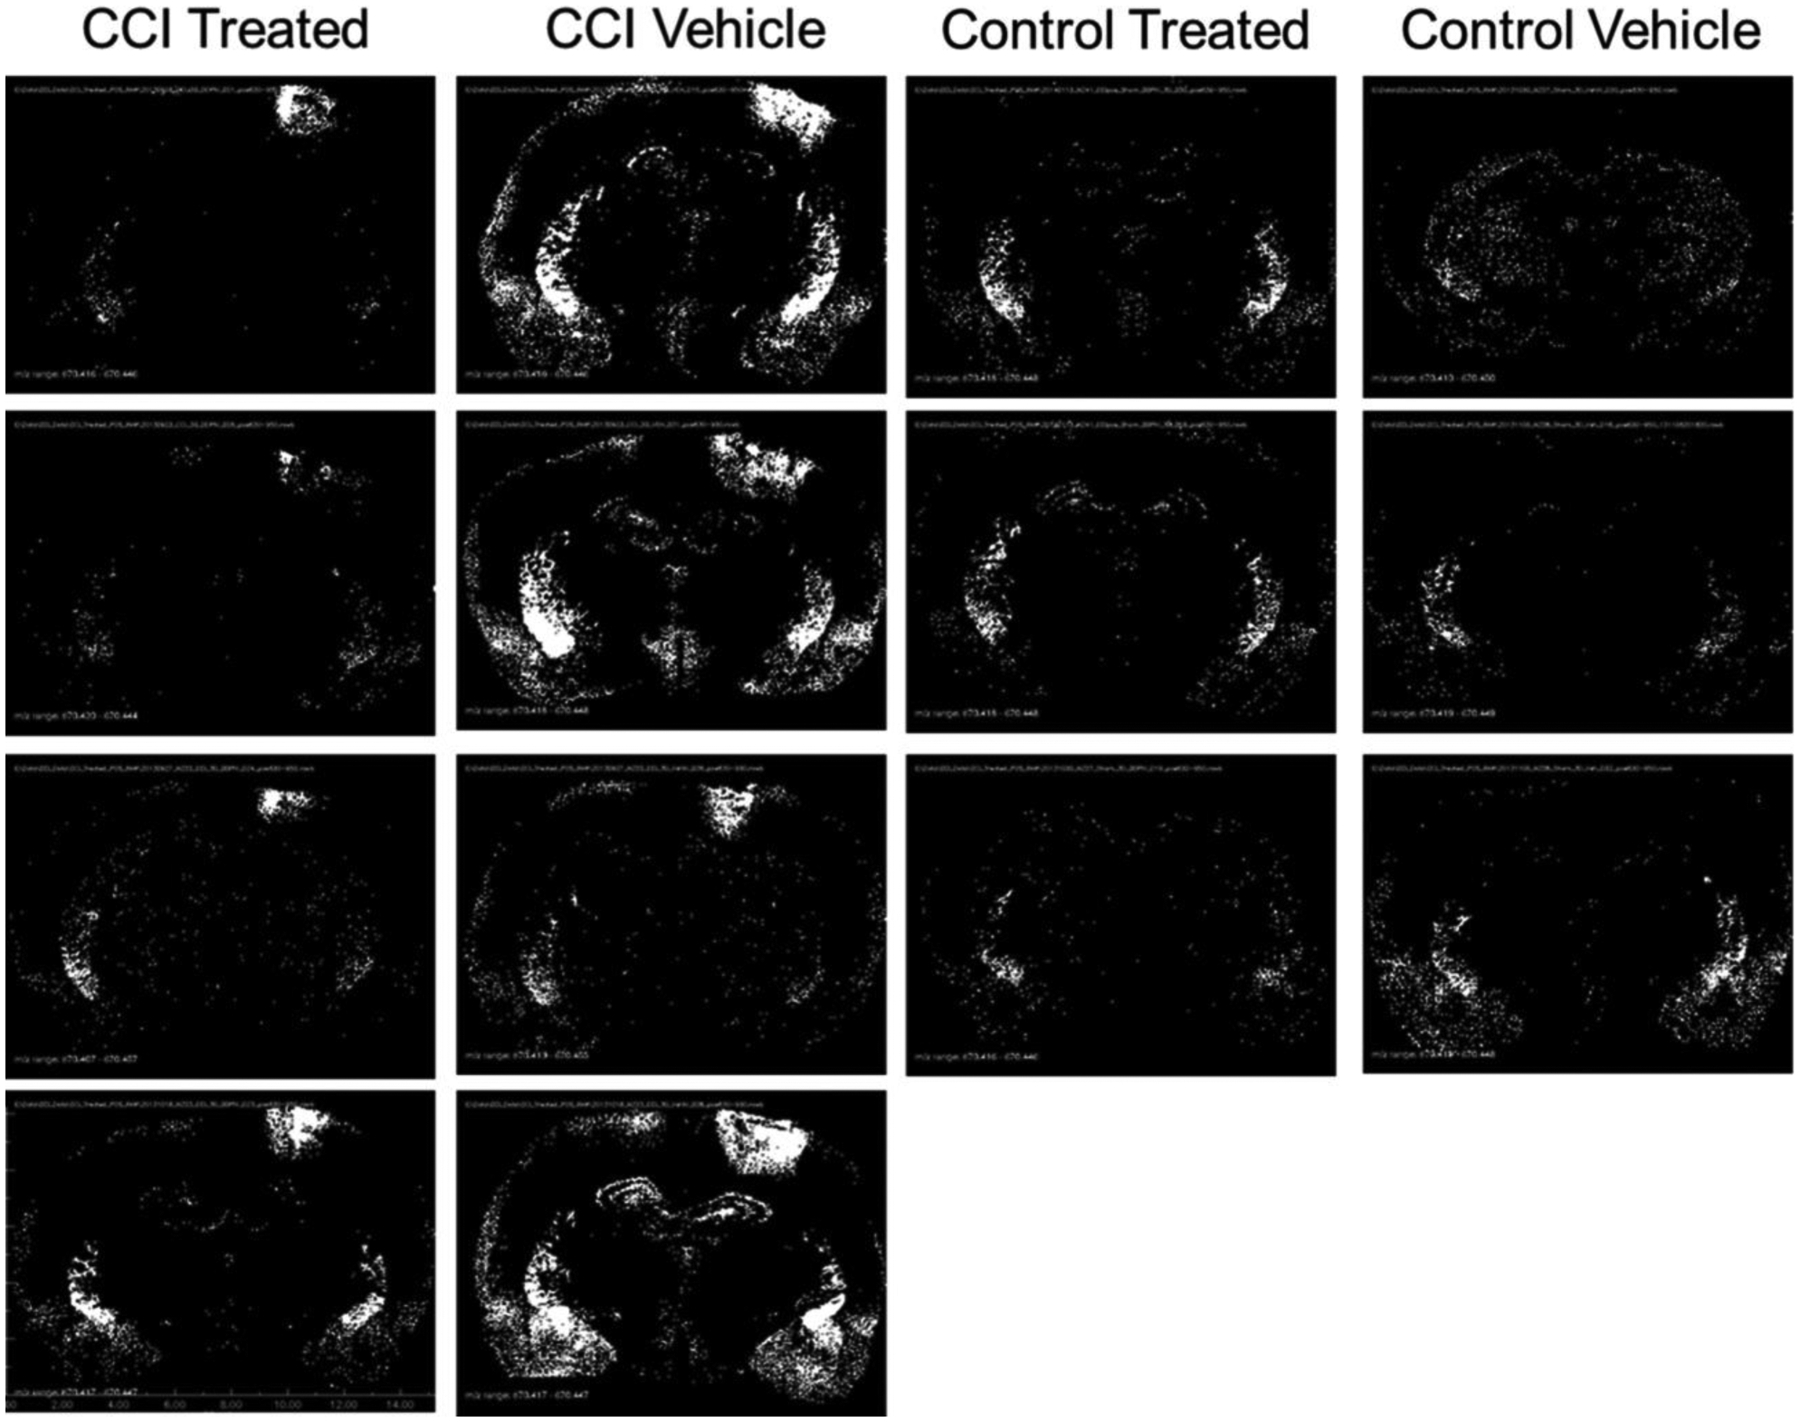
Figure 8.

Distribution of CER 36:2 (m/z 670.4328) displayed as binary images of pixels exceeding peak area threshold. Black pixels represent peak area less than or equal to 345 000 counts, and white pixels represent peak areas greater than 345 000 counts.
