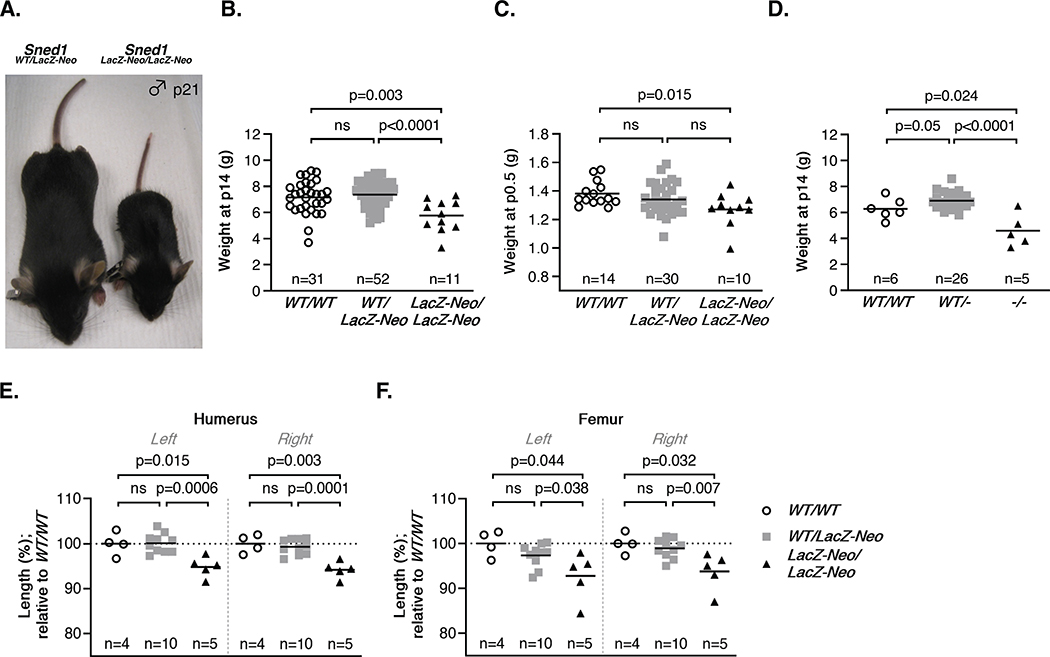
Figure 3. Surviving Sned1 knockout mice present growth defects.
A. Representative pictures of heterozygous (left) and knockout (right) 21-day-old mice illustrate the smaller size of surviving knockout mice.
B. Dotplots represent the weight of 14-day-old pups of the LacZ-Neo transgenic line. Numbers of mice per genotype are indicated. Line represents average weight of the genotype group. Statistical analysis was performed using an unpaired t-test.
C. Dotplots represent the weight of p0.5 neonates of the LacZ-Neo transgenic line. Numbers of mice per genotype are indicated. Line represents average weight of the genotype group. Statistical analysis was performed using an unpaired t-test.
D. Dotplots represent the weight of 14-day-old pups of the null transgenic line. Numbers of mice per genotype are indicated. Line represents average weight of the genotype group. Statistical analysis was performed using an unpaired t-test.
E-F. Dotplots represent the length of the humerus (E) and femur (F) of 19 adult (6-month-old) mice of the LacZ-Neo transgenic line. Numbers of mice per genotype are indicated. Line represents average weight of the genotype group. Statistical analysis was performed using an unpaired t-test.

