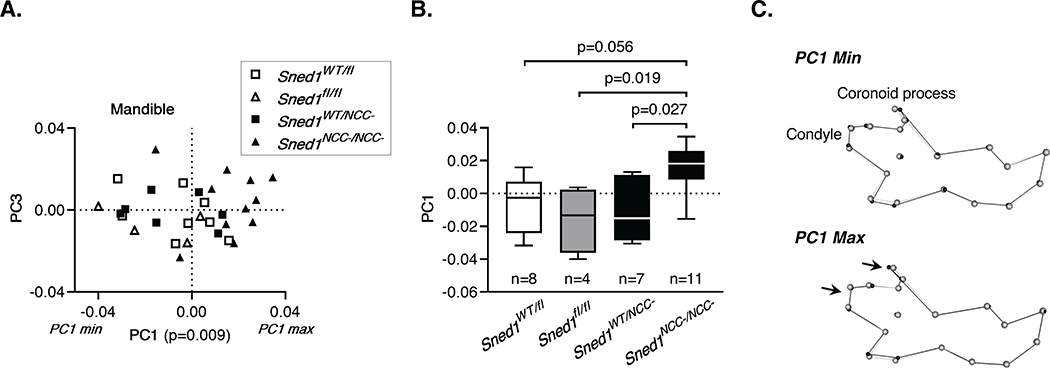
Figure 8. NCC-specific Sned1 knockout results in under-developed mandible.
A-C. Examination of the mandible of a cohort of 30 adult (7 to 15-month old) mice of the Sned1NCC- transgenic line.
A. Scatterplot of PC1 and PC3 for variation in the mouse mandibular morphology. Statistical analysis was performed using a one-way non-parametric Kruskal-Wallis ANOVA.
B. Boxplot of mandibular PC1 data by mouse genotype. Numbers of mice per genotype are indicated. Statistical analysis was performed using a Tukey’s HSD test.
C. Wireframes depicting mouse mandible side view and variations as a function of genotypes. Grey dots represent the consensus cranium shape, and black dots represent the shape depicted by minimum (upper panel; representative of most Sned1WT/fl, Sned1fl/fl and Sned1WT/NCC- mice) and maximum (lower panel; representative of most Sned1NCC-/NCC- mice) PC1 range.

