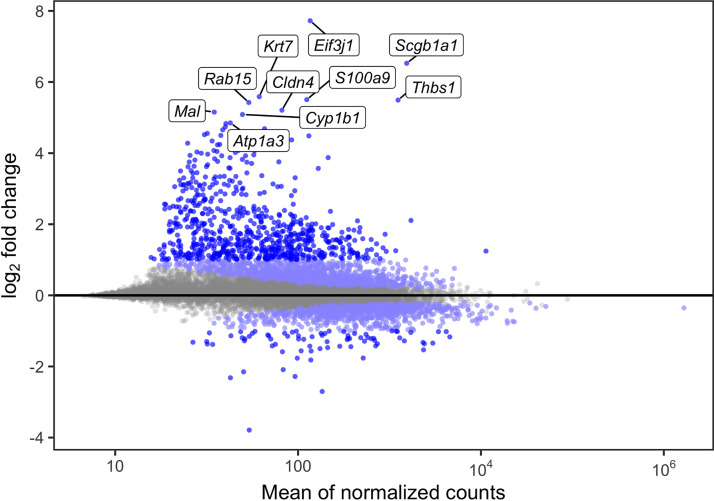
Figure 5.
O3 exposure causes characteristic changes in airway macrophage (AM) gene expression. The union set of the light blue and royal blue dots are all significantly differentially expressed genes (2,761; FDR < 0.05). The royal blue dots alone represent those with absolute log2 fold change > 1 (773). The top 10 most highly differentially expressed genes are labeled (n = 13,594 genes tested). FDR, false-discovery rate.

