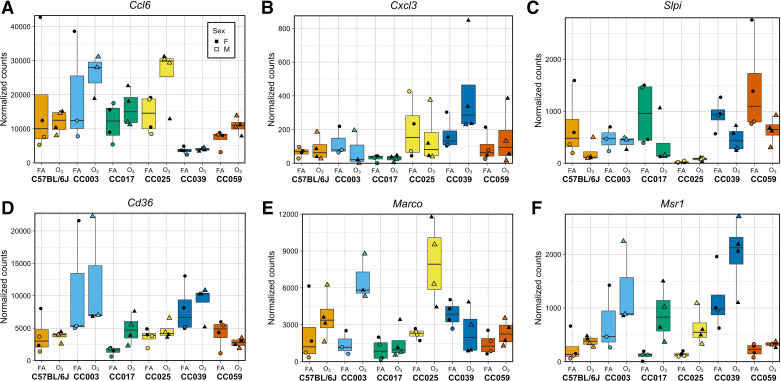
Figure 6.
Numerous genes display strain-by-O3 exposure effects on expression, including those with putative and known roles in O3 responses. A–C represent immune response genes, whereas D–F are scavenger receptors. Some genes display interactive effects across all strains (e.g., Marco, Msr1), whereas others are selectively observed in only some strains (e.g., Ccl6, Cxcl3, Slpi). Circles represent filtered air exposed mice and triangles represent O3-exposed mice. Closed points represent female animals and open points represent male animals. [n = 2 mice per treatment/sex/strain except CC003 where n = 1 female/2 males per treatment; all genes have one or more significant strain-by-O3 exposure effects on expression (FDR < 0.05)]. FDR, false-discovery rate; O3, ozone.

